Content Manager Reports
Skill Lake provides Reports for Content Managers (users with Content Manager privileges) to monitor the courses created or managed by them efficiently.
The Reports section is divided into Self-paced courses and Instructor-led courses.
Self-paced courses
In this section, the Content Managers can view the course enrollment summary, learner enrollment summary, test results, feedback summary and pre & post assessment summary of the self-paced courses.
Summary
The Content Managers can view the enrollment summary of the self-paced courses they create/manage in the Summary report.
At a glance

The ‘At a glance’ section displays the total number of enrollments that occurred during the selected period for the selected course category/levels. You may get the count of learners in the various stages of course completion.
Enrollment breakdown
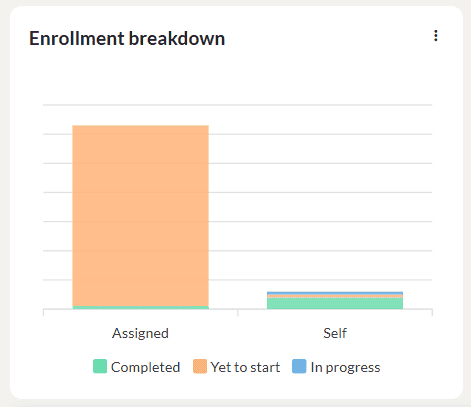
This graph displays the count of self-enrolled and assigned self-paced courses in the completed, in progress, and yet to start statuses. Click on the three dots to download the graph as SVG, PNG or CSV.
Enrollment status overview
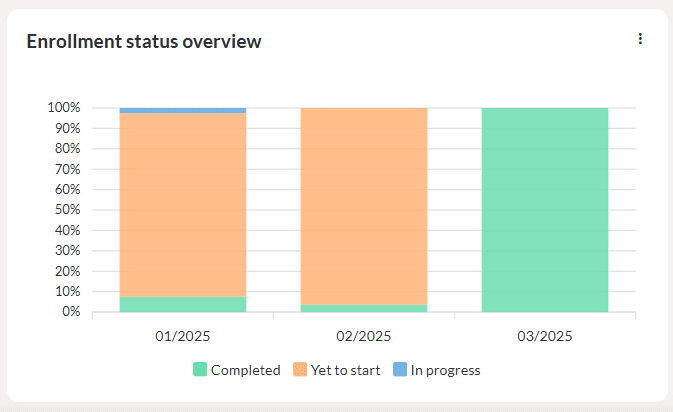
This graph displays the enrollment status of the learners in percentages in the completed, in progress and yet to start status. Click on the three dots to download the graph as SVG, PNG or CSV.
Top courses
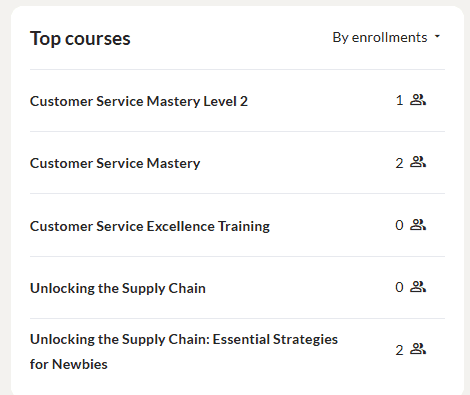
This section displays the popular courses in which the highest number of enrollments has occurred. You may click on the arrow to display the courses based on the highest enrollments/completions.
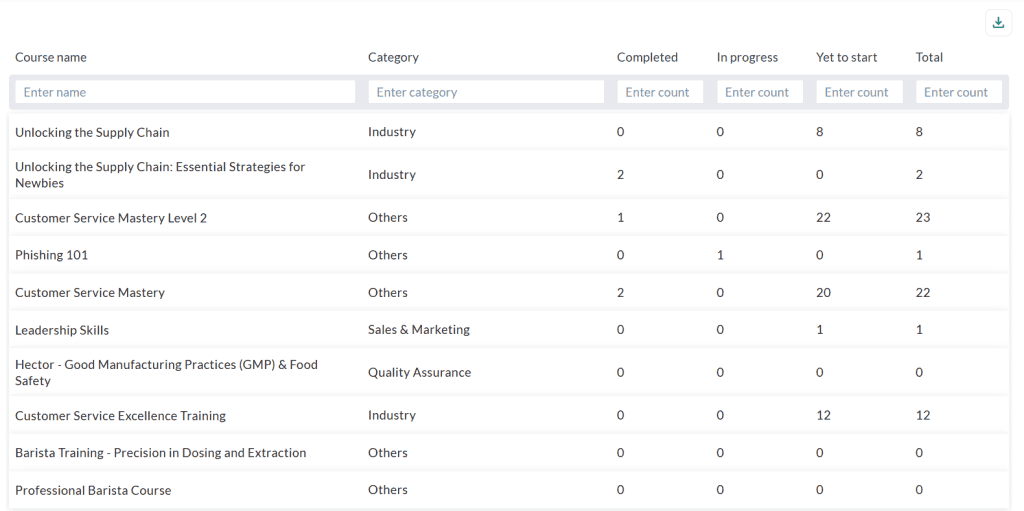
- The Content Managers can view the course name, category and the count of learners in various stages of course completion.
- Click the Download icon to export the course enrollment summary report in CSV format.
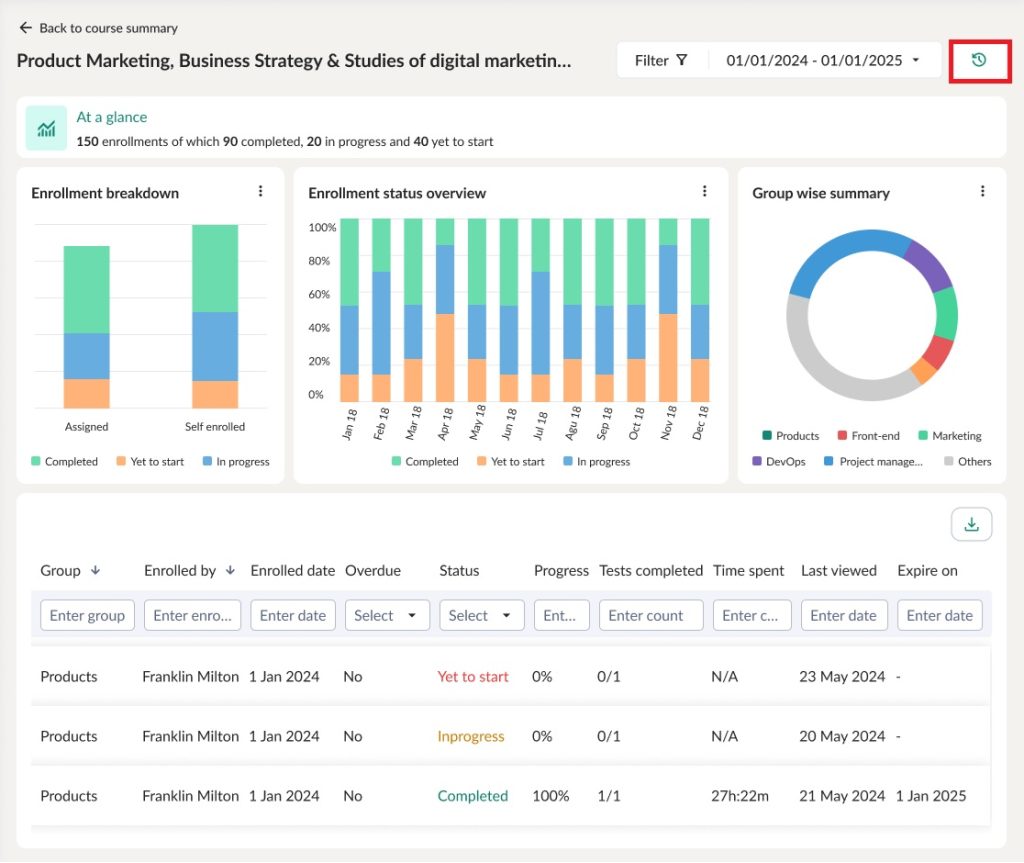
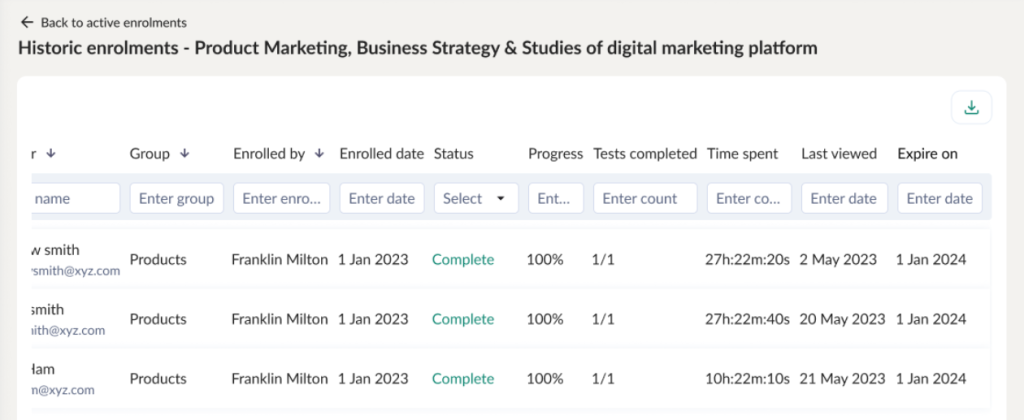
Click on the required course to view the enrollment breakdown, enrollment status overview, group wise summary and the learner enrollments for that course, which includes the course status, tests completed, last accessed date and expire date. The total time spent by the learner will be displayed. You may filter the report based on the filter options. Click on the icon to view the historic enrollments of the learner.
Learners
In the Learners report, the Content Managers can select a specific self-paced course created/managed by them and view the list of learners enrolled in the courses along with their enrollment details and learning progress.
At a glance

The ‘At a glance’ section displays the total number of enrollments that occurred during the selected period and filters. You may view the count of learners that have completed, in progress and yet to start status.
Enrollment breakdown
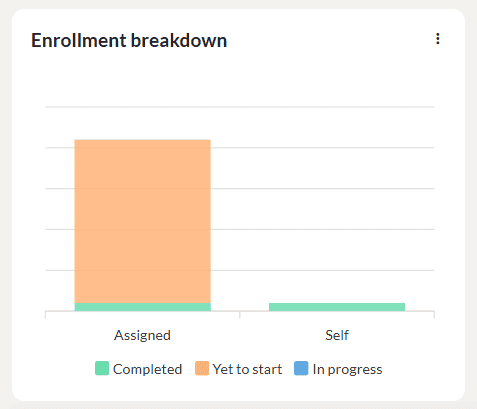
This graph displays the count of self-enrolled and assigned self-paced courses in the completed, in progress and yet to start status. Click on the three dots to download the graph as SVG, PNG or CSV.
Enrollment status overview
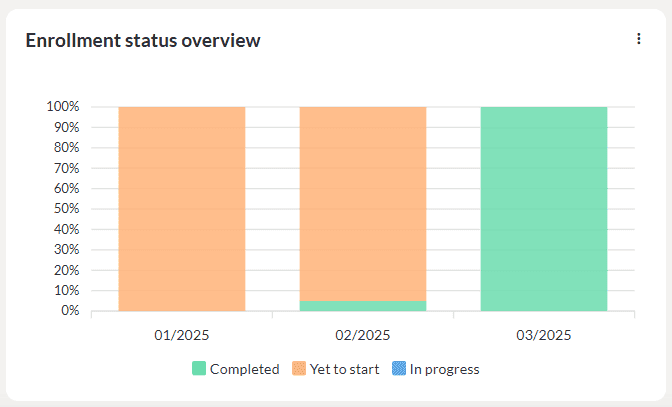
This graph displays the enrollment status of the learners in percentages in the completed, in progress and yet to start status. Click on the three dots to download the graph as SVG, PNG or CSV.
Group-wise summary
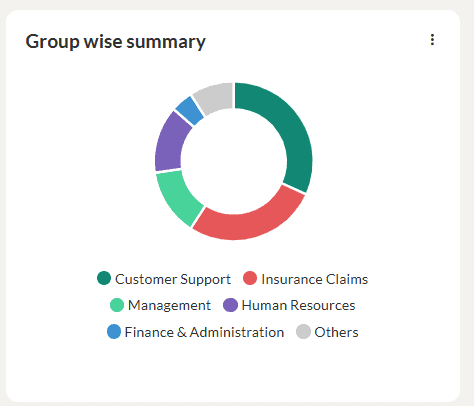
This section displays the group wise enrollment of courses. Click on the three dots to download the graph as SVG, PNG or CSV.
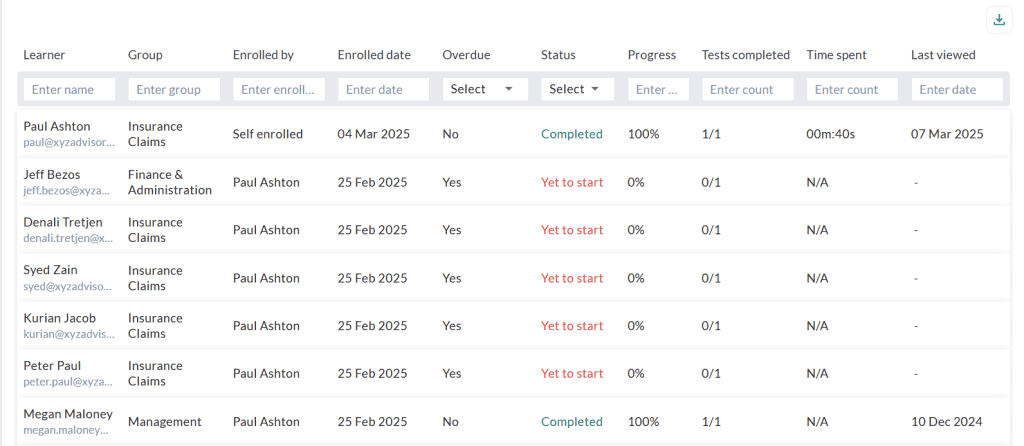
- You can view the learner name, group, overdue, status, progress percentage, and expired on date.
- The total time spent by the learner will be displayed.
- Click the Download icon to export the course enrollment summary report in CSV format.
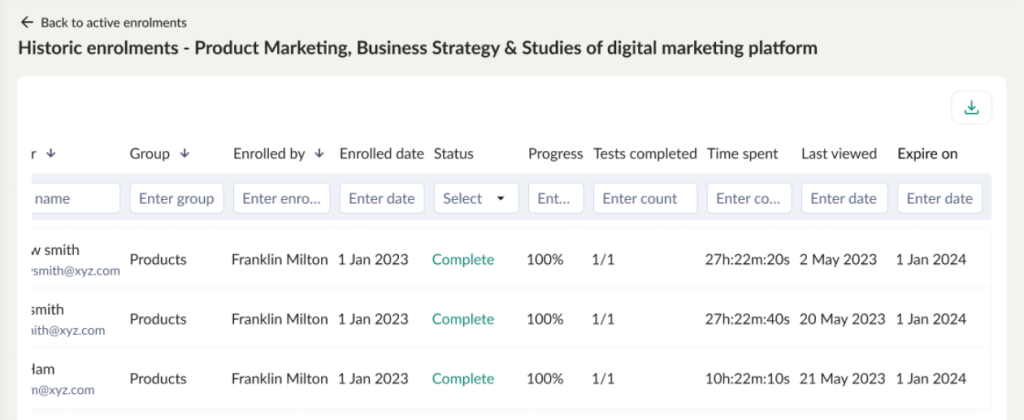
Click on the Historic Enrollments icon to view the historic enrollments of the learner. If course expiration is enabled in the Course Settings and your course completion expires, your enrollment automatically moves to Historical Enrollments.
Test results
The Content Managers can view the test results of all the learners of the selected self-paced course.
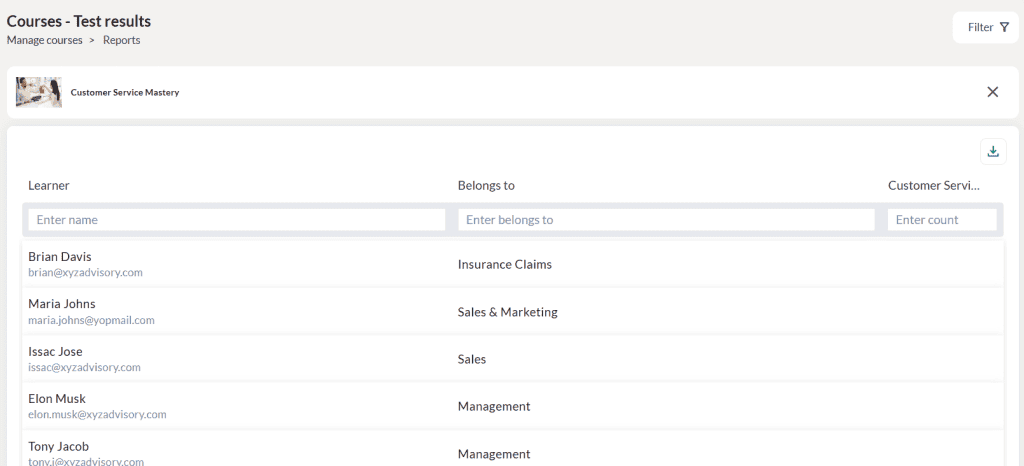
- Select a course for which you want to view the test result of the learners.
- Click the Download icon to export the test result report in CSV format.
Feedback summary
In this report, the Content Managers can view the feedback received from all the learners for the selected course.
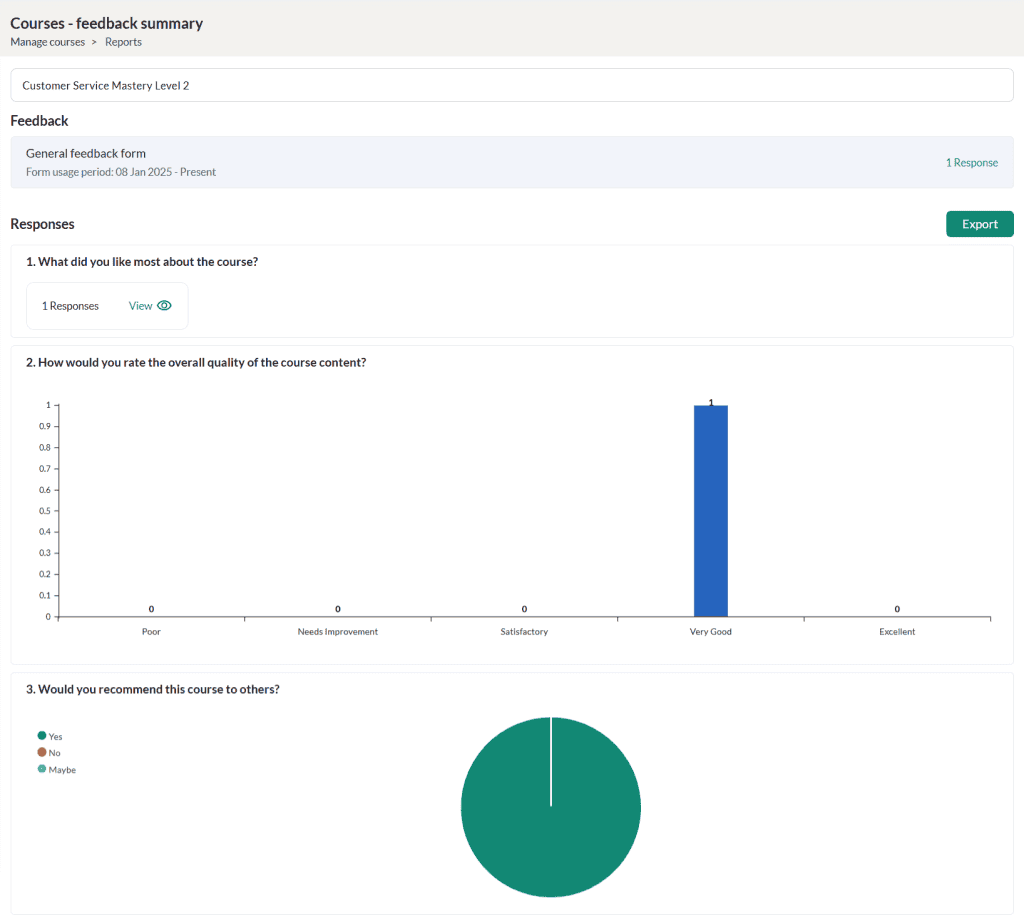
- Select a course for which you want to view the feedback.
- The responses will be displayed based on the type of questions you have answered in the feedback form.
- If you have answered a multiple choice single answer question, then the response will be displayed as a pie-chart.
- If you have answered a rating question, then the response will be displayed as a bar chart.
- If you have answered a free text question, then click on the View icon to view the response.
- Click on the Export button to export the report to CSV format.
Pre & post assessment summary
The Content managers can click on the Pre & post assessment summary report to view the summary of the pre and post assessment of the tests conducted for the learners in the selected self-paced course.
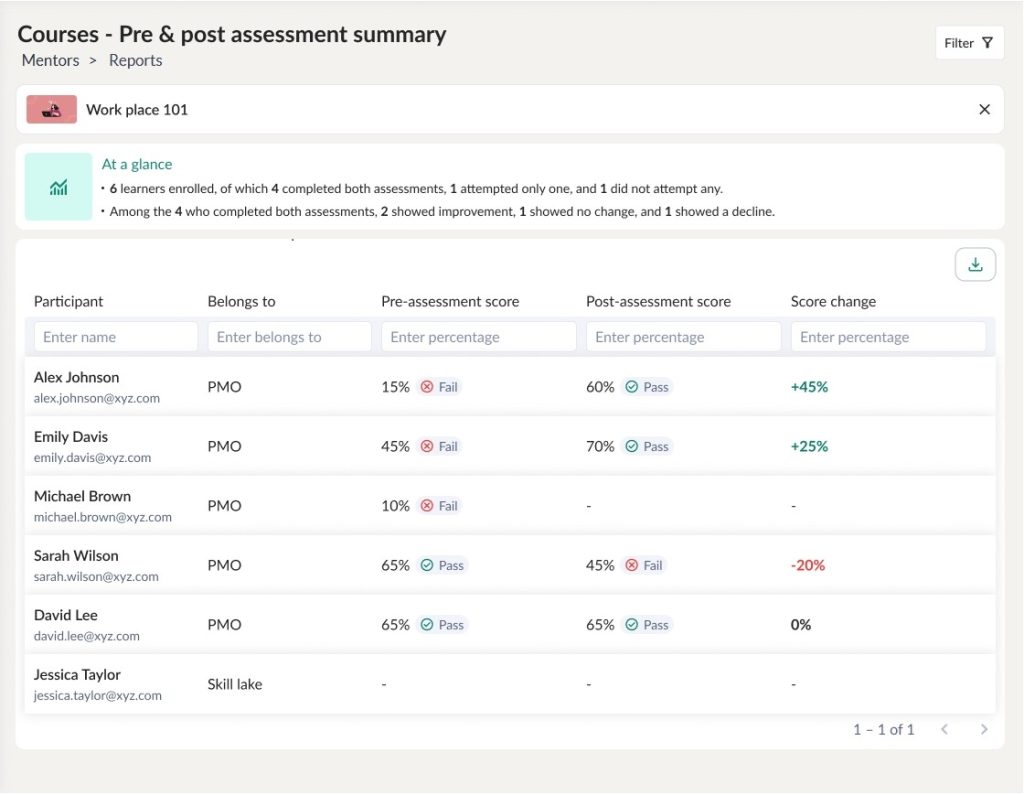
- Select a course for which you want to view the pre and post assessment report of the learners.
- At a glance section displays the total learners attended the test and those who completed the assignments.
- This report displays the belongs to department, pre-assessment score, post assessment score and score change.
- Click the Download icon to export the report in CSV format.
Instructor-led courses
In this section, the Content Managers can view the summarized report of course enrollment, batch enrollment, learner enrollment, test result, feedback summary, attendance summary and pre & post assessment summary for the instructor-led courses.
Course Summary
In the Course Summary tab, the Content Managers can view the enrollment summary of the instructor-led courses they create/manage.
At a glance

The ‘At a glance’ section displays the total number of enrollments that occurred across the batches during the selected period for the selected course category/levels. This section displays the count of learners that are completed, in progress, and yet to start status.
Enrollment status overview
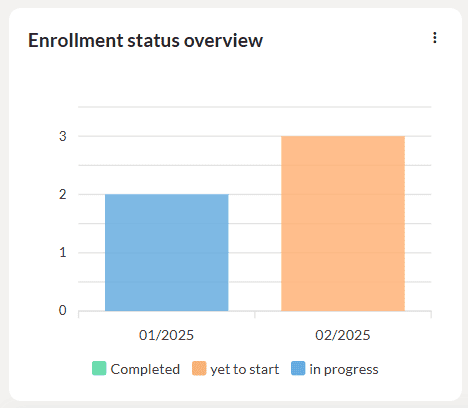
This graph displays the count of ILT courses completed, in progress and yet to start status. Click on the three dots to download the graph as SVG, PNG or CSV.
Groupwise summary
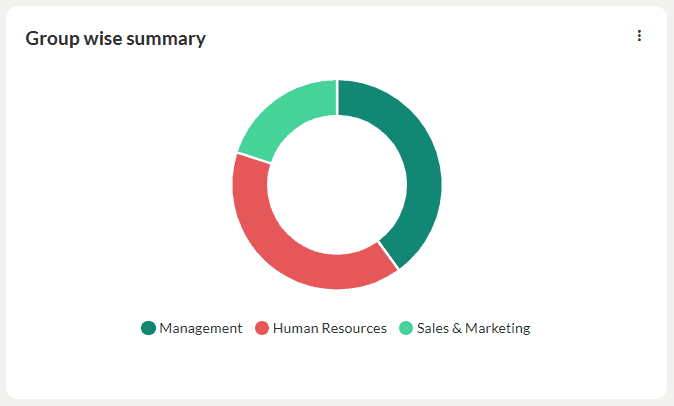
This graph displays the groupwise summary of the learners enrolled to ILT courses in the selected period/course category/levels. Click on the three dots to download the graph as SVG, PNG or CSV.
Top courses
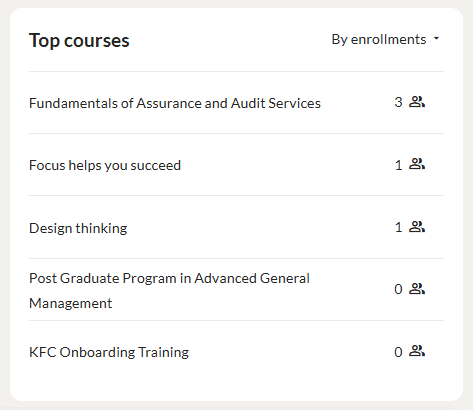
This section displays the popular courses in which the highest number of enrollments has occurred. You may click on the arrow to display the courses based on the count of enrollments/batches.
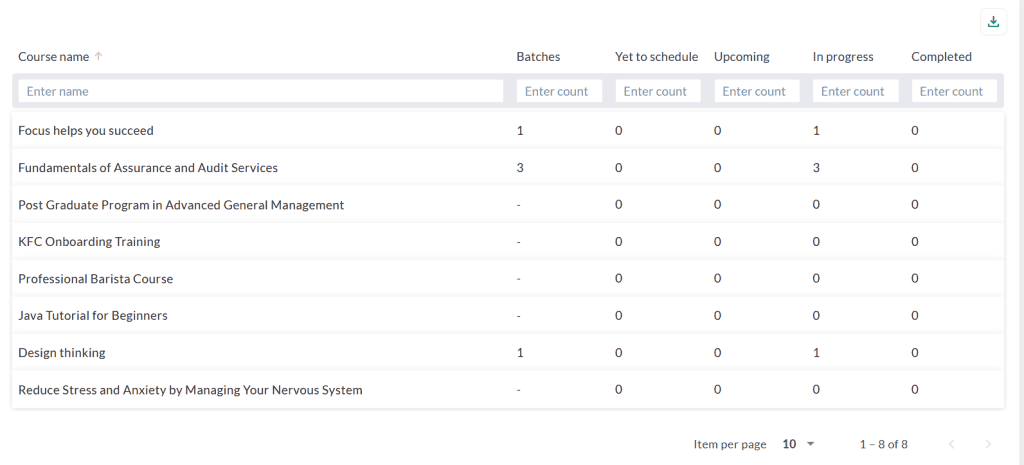
- The Content Managers can view the course name, batches and the number of learners in various stages of course completion.
- Click the Download icon to download the course enrollment summary report in CSV format.
Batch Summary
The Content Managers can view the batchwise enrollment, batch name, respective course name, batch start and end date, batch status, and the count of learner enrollments.
At a glance

The ‘At a glance’ section displays the total number of enrollments that occurred across the batches during the selected period for the selected course category/levels. This section displays the count of learners in the various stages of course completion.
Enrollment breakdown
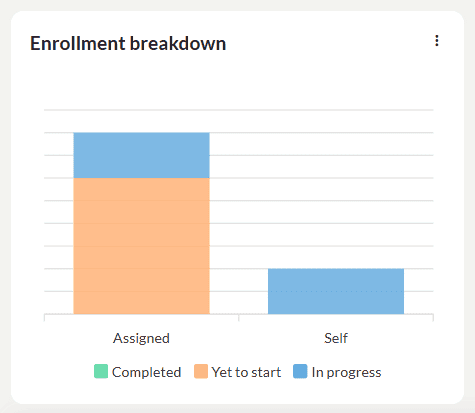
This graph displays the count of batchwise enrollment of ILT courses completed, in progress and yet to start status. Click on the three dots to download the graph as SVG, PNG or CSV.
Groupwise summary
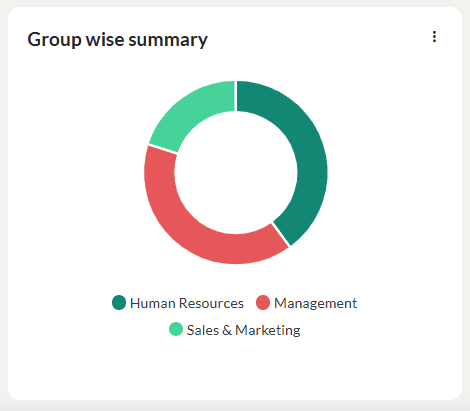
This graph displays the groupwise summary of the batchwise enrollment of ILT courses in the selected period/course and category/levels. Click on the three dots to download the graph as SVG, PNG or CSV.
Enrollment by batches
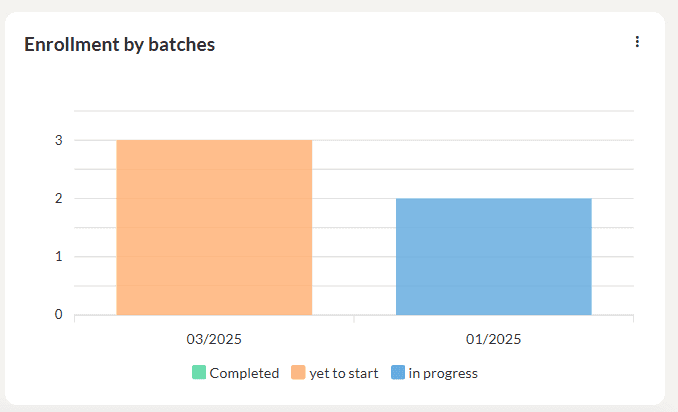
This graph displays the batchwise enrollment of ILT courses for the months in the selected period and category/levels. Click on the three dots to download the graph as SVG, PNG or CSV.

- The Content Managers can view the batch name, course name, period of learning, batch status and number of enrollments for each batch.
- Click the Download icon to download the batch enrollment summary report in CSV format.
- You can filter the batch enrollment report using the category, level and period.
Click on the batch name to display the learners enrolled in the selected batch. The total time spent by the learner will be displayed. In the learner report, you can view the enrollment details and their course completion status. Click on the Export button to export the report to excel format.

Learners
In the Learners report, the Content Managers can view the list of learners enrolled in a specific batch created/managed by them, along with their enrollment details and learning progress.
At a glance

The ‘At a glance’ section displays the total number of enrollments during the selected period and based on the selected filter conditions. This section displays the count of learners in the various stages of course completion.
Enrollment breakdown
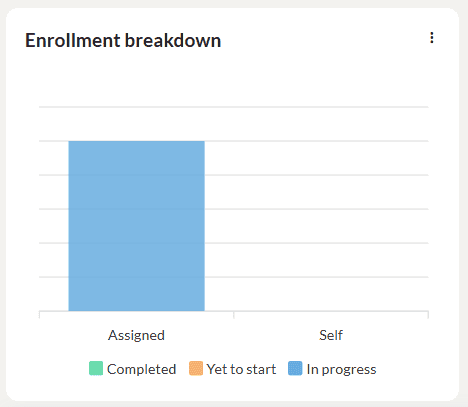
This graph displays the count of batchwise enrollment of ILT courses completed, in progress and yet to start status. Click on the three dots to download the graph as SVG, PNG or CSV.
Groupwise summary
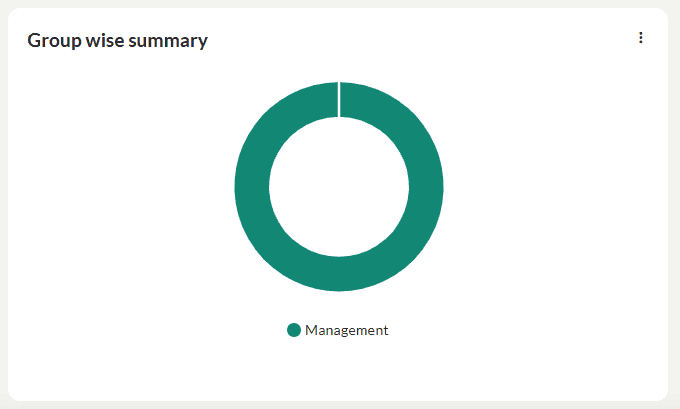
This graph displays the groupwise summary of the batchwise enrollment of ILT courses in the selected period/course and category/levels. Click on the three dots to download the graph as SVG, PNG or CSV.
Enrollment by units
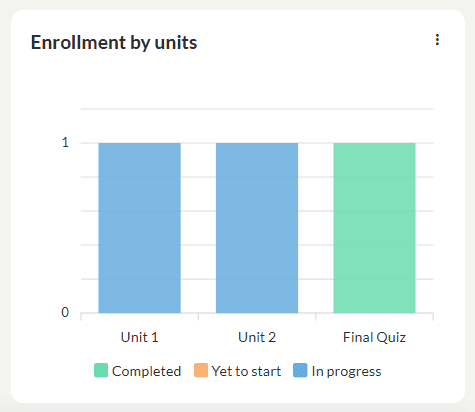
This graph displays the unitwise enrollment of ILT courses for the months in the selected period and category/levels. Click on the three dots to download the graph as SVG, PNG or CSV.

- The Content Managers can view the learner’s enrollment details and course status.
- The total time spent by the learner will be displayed.
- Click the Download icon to download the learner enrollment summary report in CSV format.
- You can filter the learner enrollment report using the group, status, learning activity and period.
Test results
The Content Managers can view the test results of all the learners of the selected instructor-led course.
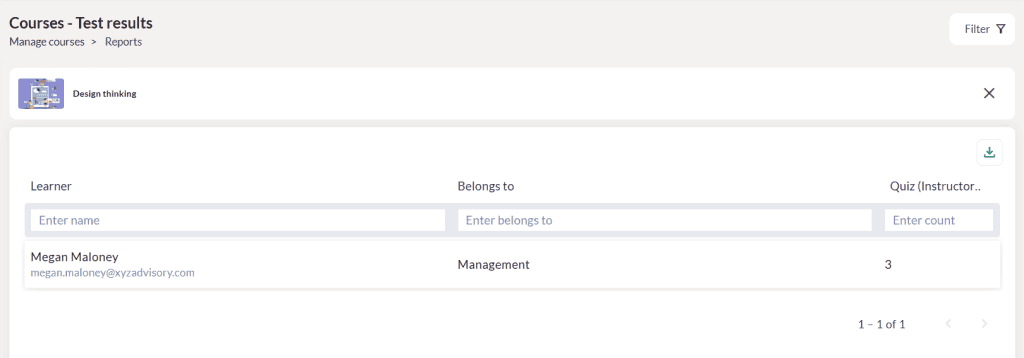
- Select a course for which you want to view the test result of the learners.
- Click the Download icon to export the test result report in CSV format.
Feedback summary
In this report, the Content Managers can view the feedback received from all the learners for the selected course.
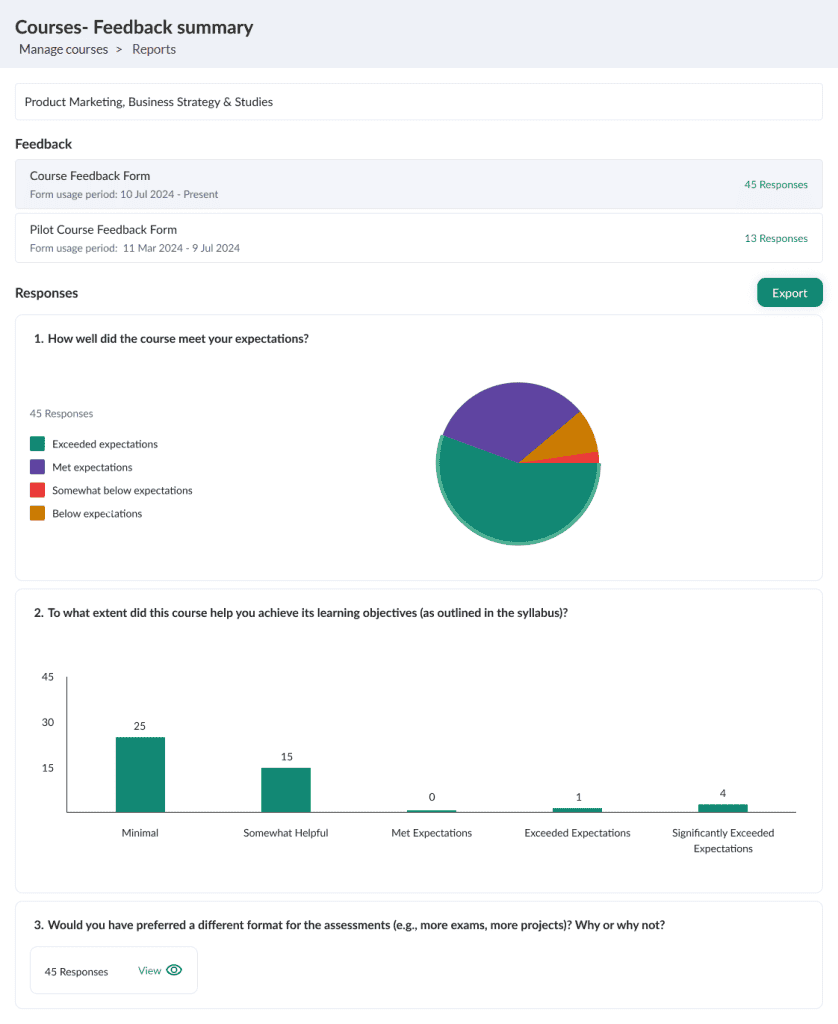
- Select a course for which you want to view the feedback.
- The responses will be displayed based on the type of questions you have answered in the feedback form.
- If you have answered a multiple choice single answer question, then the response will be displayed as a pie-chart.
- If you have answered a rating question, then the response will be displayed as a bar chart.
- If you have answered a free text question, then click on the View icon to view the response.
- Click on the Export button to export the report to CSV format.
Attendance summary
In this report, the Content Managers can view the attendance details of all sessions in the selected batch.
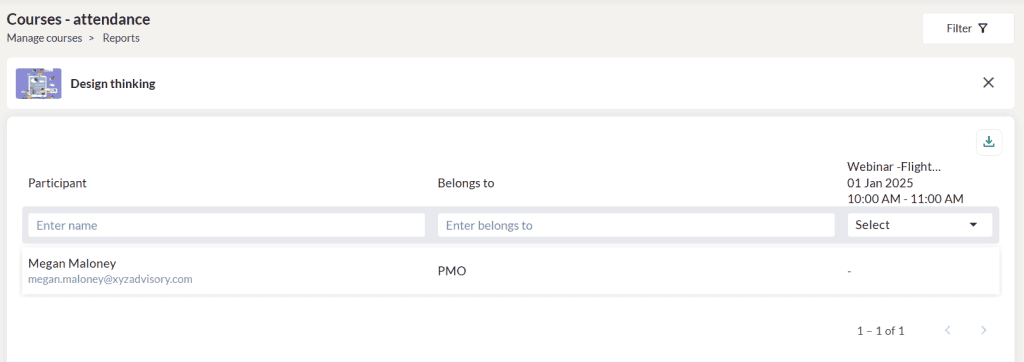
- Select a batch for which you want to view the learner name, belongs to group and session attended.
- Click on the Export button to export the report to CSV format.
Pre & post assessment summary
The Content Managers can click on the Pre & post assessment summary menu to view the summary of the pre and post assessment for the tests conducted for the learners in the selected self-paced course.
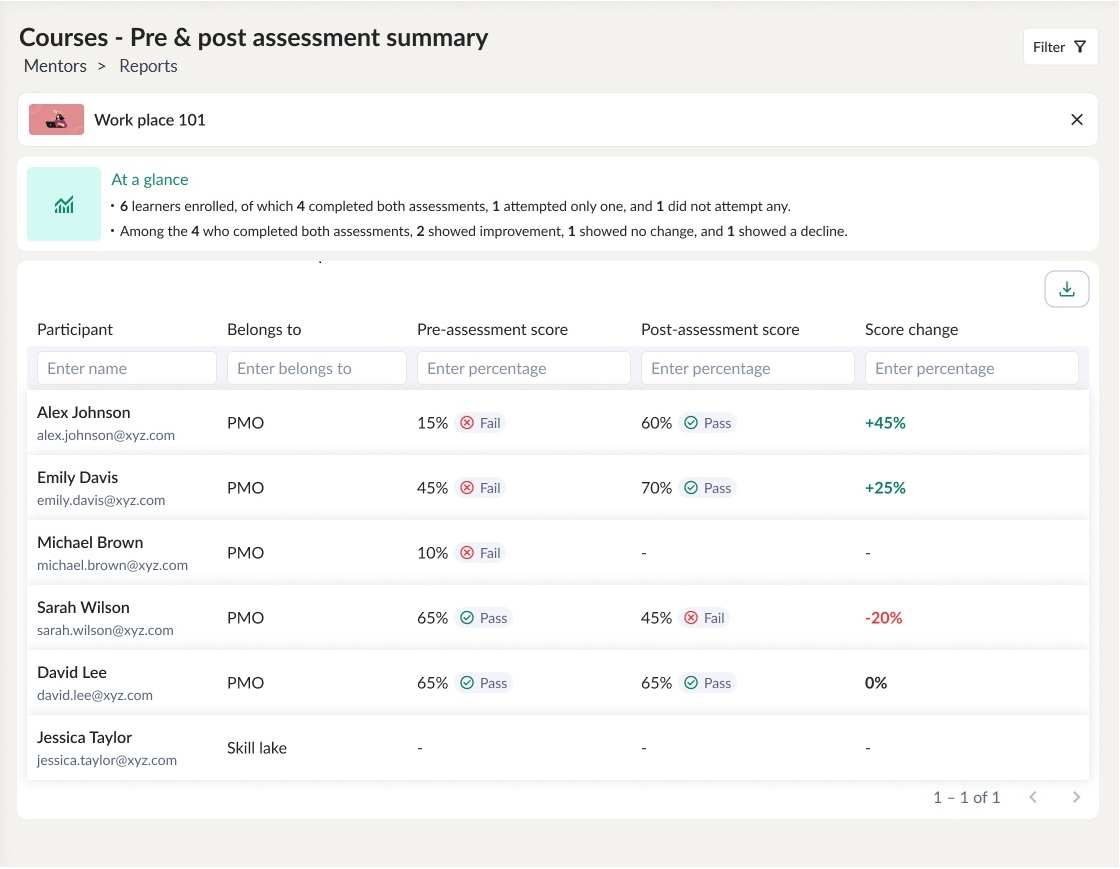
- Select a course for which you want to view the pre and post assessment report of the learners.
- At a glance section displays the total learners attended the test and those who completed the assignments.
- This report displays the belongs to department, pre-assessment score, post assessment score and score change.
- Click the Download icon to export the report in CSV format.