Reports
- Learners enrollment summary
- Learner’s past 7 days’ activity
- Enrollment summary of the self-paced courses
- Learner enrollment for self-paced courses
- Leaner’s Test results for a self-paced course
- Leaner’s pre & post assessment summary of self-paced courses
- Enrollment summary of the instructor-led course batches
- Learner’s enrollment for instructor-led courses
- Learner’s Test results for an instructor-led course
- Attendance summary
- Learner’s pre & post assessment summary of instructor-led courses
- Enrollment summary of the learning paths
- Viewing learner enrollments for a learning path
- Reporting line summary
- Viewing Organization leaderboard
- Viewing Segmented leaderboard
- Viewing My learner’s leaderboard
Skill Lake provides Reports for Mentors (users with Mentoring privileges) within the “Mentor” tab to assist them in efficiently monitoring the progress made by their learners.
The Reports section is divided into four subsections: Learners, Self-paced Courses, Instructor-led Courses, and Reporting Line. These reports assist mentors in efficiently monitoring learner progress and course engagement.
Learners
In the Learners tab, the mentors can view 2 reports: – the Enrollment summary report and the report on the past 7 days of activity of the learners assigned to them.
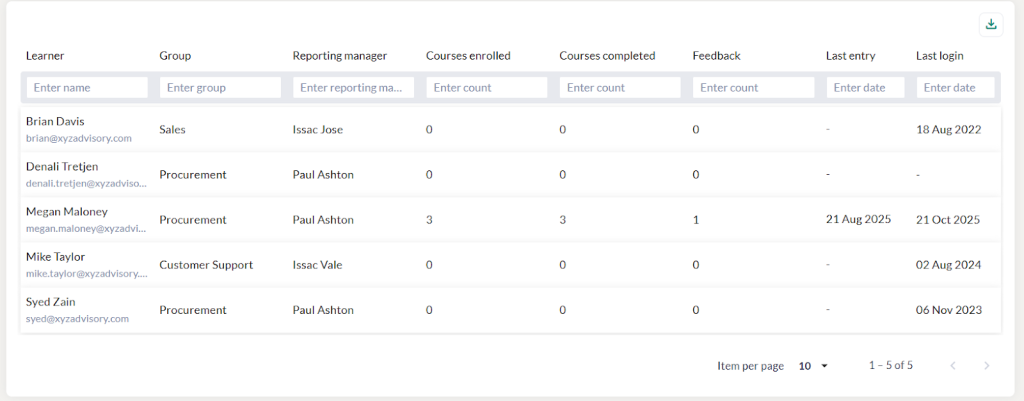
Learners enrollment summary
Click on the Summary menu to view the summary of course enrollments for each learner. The mentors can view the name, organizational group, reporting manager, count of courses enrolled, completed courses and journal entries, last entry date and the last login date of the learner. Also, the count of learners, mentors, and course assignments are displayed.
At a glance

The ‘At a glance’ section displays the:
- Total number of enrollments among the various courses (self paced and instructor-led) and the count of learners in the various stages of course completion.
- Count of feedback received from the learners.
- The data is displayed based on the selected period in the selected group/reporting manager.
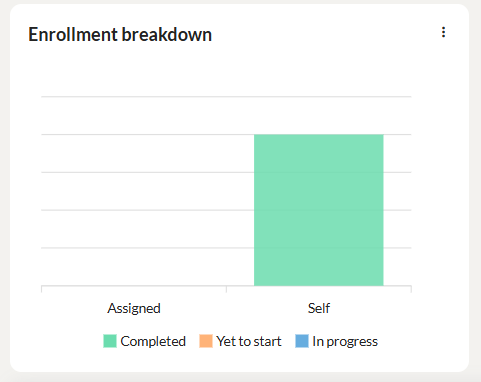
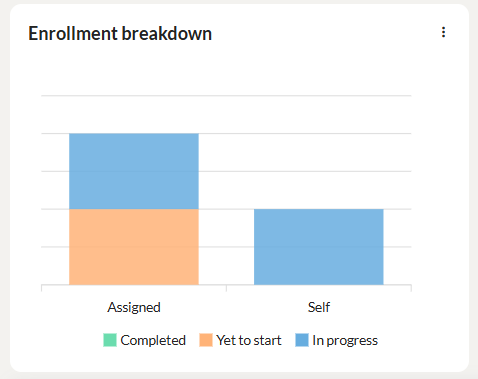
Enrollment breakdown
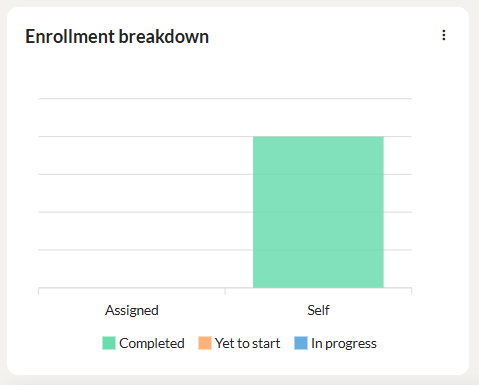
- This graph displays the count of self enrolled and assigned courses(both self-paced and instructor-led) in the completed, in progress and yet to start status.
- Click on the three dots to download the graph as SVG, PNG or CSV.
Enrollment status overview
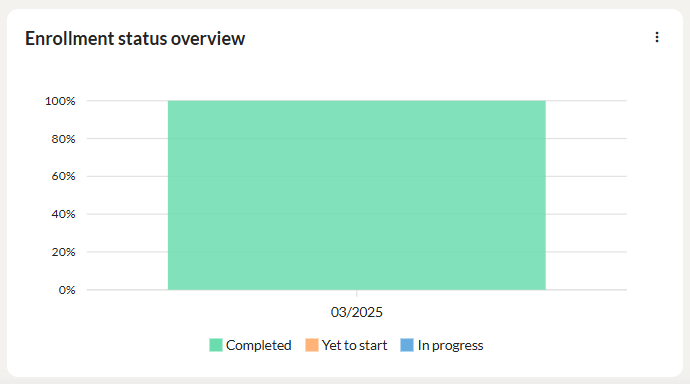
- This graph displays the enrollment status of the learners in percentages for the selected period in the completed, in progress and yet to start status.
- Click on the three dots to download the graph as SVG, PNG or CSV.
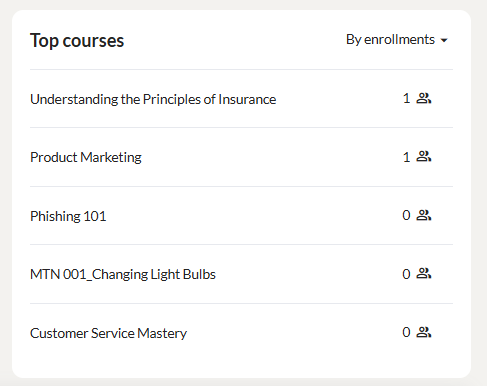
Top learners
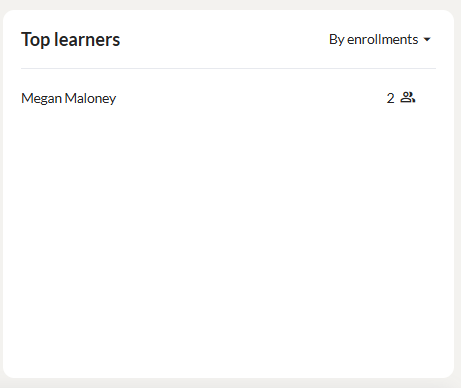
This section displays the top learners in which the highest number of course completions/enrollments occurred.
- Administrators can view the learner name, group to which he is part of, reporting manager, count of courses enrolled, completed and feedback received from the learners, learner’s last entry date and previous login date.
- Click the Download icon to export the learner enrollment summary report in CSV format.
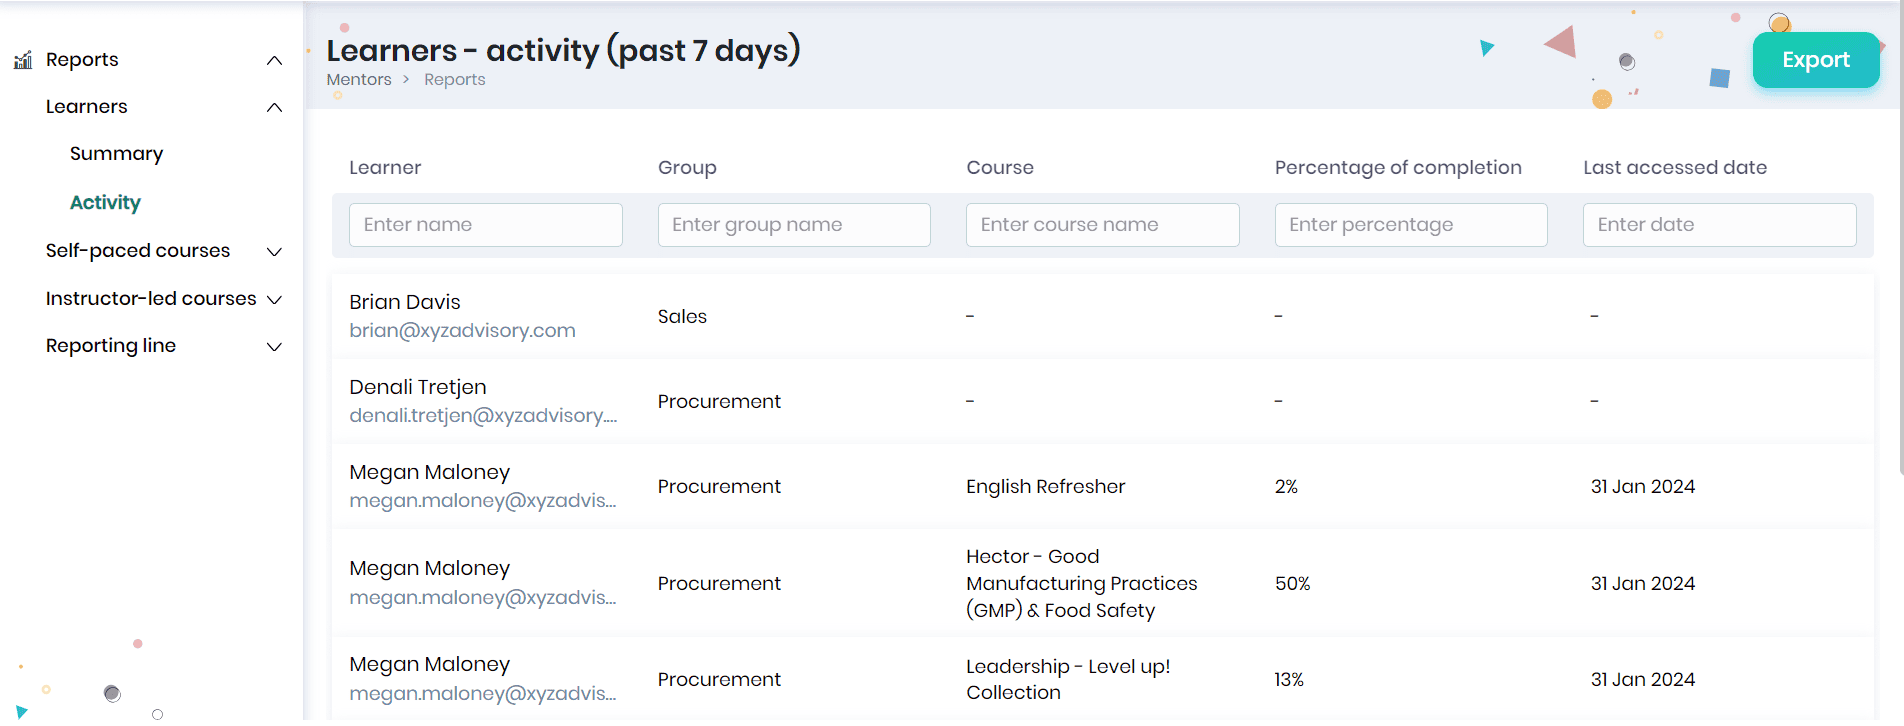
Learner’s past 7 days’ activity
Click the Activity menu to track your learners’ activities in the past seven days. The mentors can view the learner’s name, organizational group, course accessed, percentage of completion, and last access date of the course.
You can filter the report by any of the columns, such as learner name, group name, course name, percentage of completion, and last accessed date.
Click the Export button to export the learner’s past activity in Excel format. You can communicate with your learners using the email IDs you get while exporting the report to Excel.
Note: A notification email will be sent to the mentors with a summarizing their learners’ learning activities in the past week.
Self-paced Courses
In the Self-paced Courses menu, the mentors can view 4 reports – the Enrollment summary, the report on learner enrollments for a specific course, test results and pre and post assessment summary for a particular course.
Enrollment summary of the self-paced courses
Click on the Summary menu to view the enrollment summary of the self-paced courses.
At a glance

- The ‘At a glance’ section displays the total number of enrollments that occurred during the selected period for the selected course category/levels.
- You may get the count of learners in the various stages of course completion.
Enrollment breakdown
- This graph displays the count of self enrolled and assigned self paced courses in the completed, in progress and yet to start status.
- Click on the three dots to download the graph as SVG, PNG or CSV.
Enrollment status overview

- This graph displays the enrollment status of the learners in percentages in the completed, in progress and yet to start status.
- Click on the three dots to download the graph as SVG, PNG or CSV.
Top courses
- This section displays the popular courses in which the highest number of enrollments has occurred.
- You may click on the arrow to display the courses based on highest enrollments/completions.
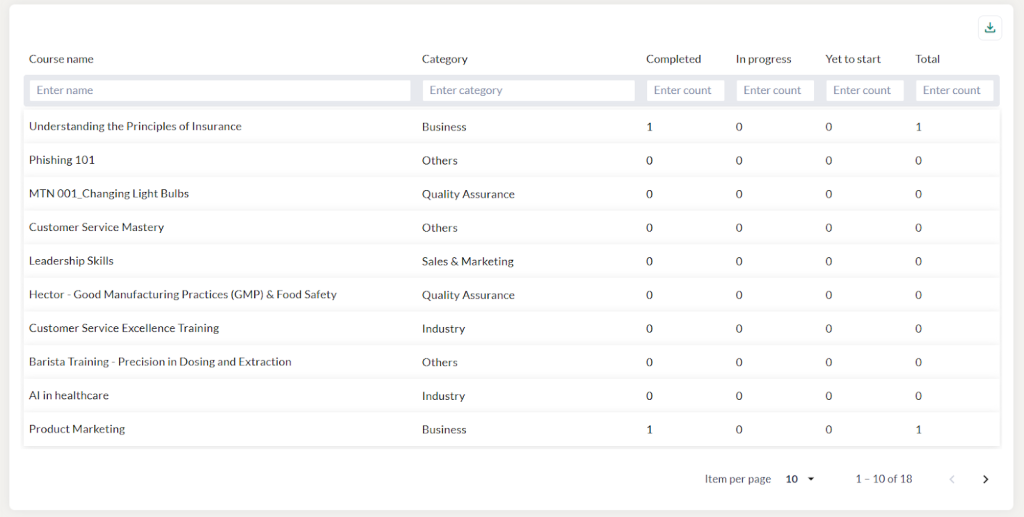
- The Mentors can view the course name, category and the count of learners in various stages of course completion.
- Click the Download icon to export the course enrollment summary report in CSV format.
- Click on the required course to view the enrollment breakdown, enrollment status overview, group wise summary and the learner enrollments for that course, which includes the course status, tests completed, and last accessed date.
- The total time spent by the learner will be displayed. You may filter the report based on the filter options.
- Click on the icon to view the historic enrollments of the learner.
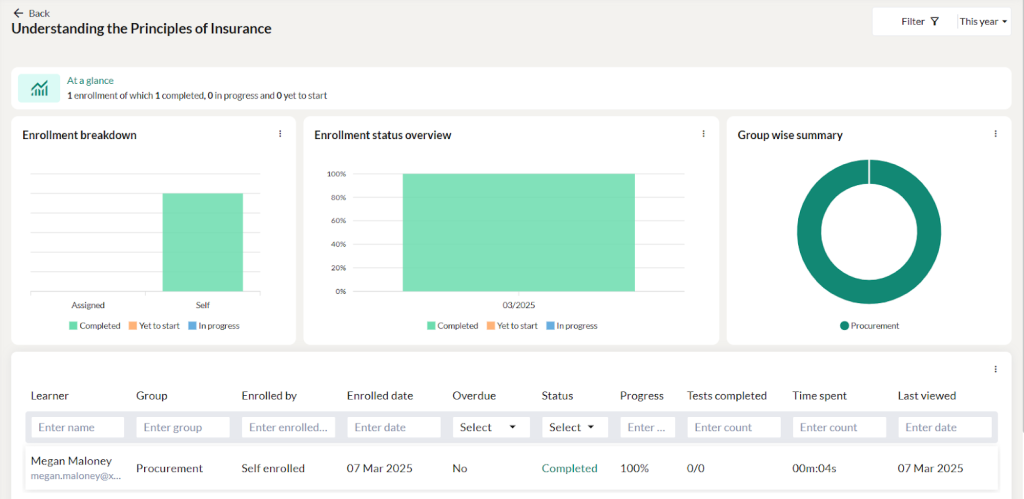
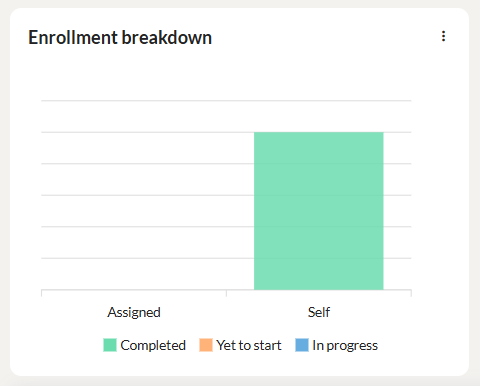
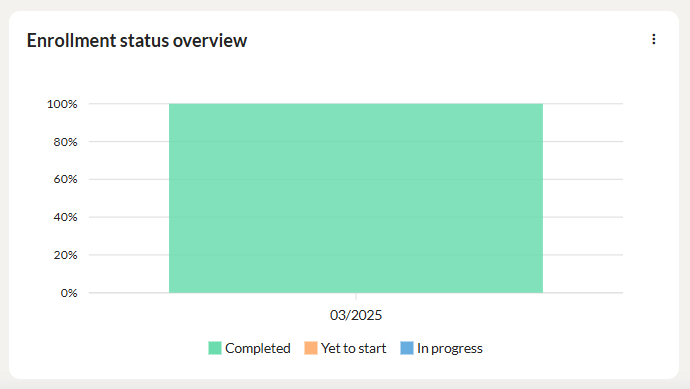
Learner enrollment for self-paced courses
In the Learners report, the Mentors can select a specific self-paced course created/managed by them and view the list of learners enrolled in the courses along with their enrollment details and learning progress.
At a glance

- The ‘At a glance’ section displays the total number of enrollments that occurred during the selected period and filters.
- You may view the count of learners that have completed, in progress and yet to start status.
Enrollment breakdown
- This graph displays the count of self enrolled and assigned self paced courses in the completed, in progress and yet to start status.
- Click on the three dots to download the graph as SVG, PNG or CSV.
Enrollment status overview
- This graph displays the enrollment status of the learners in percentages in the completed, in progress and yet to start status.
- Click on the three dots to download the graph as SVG, PNG or CSV.
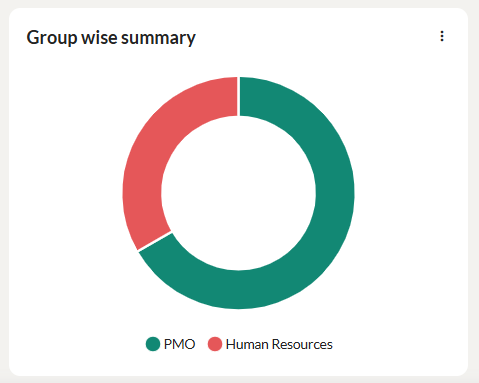
Group wise summary
- This section displays the group wise enrollment of courses.
- Click on the three dots to download the graph as SVG, PNG or CSV.
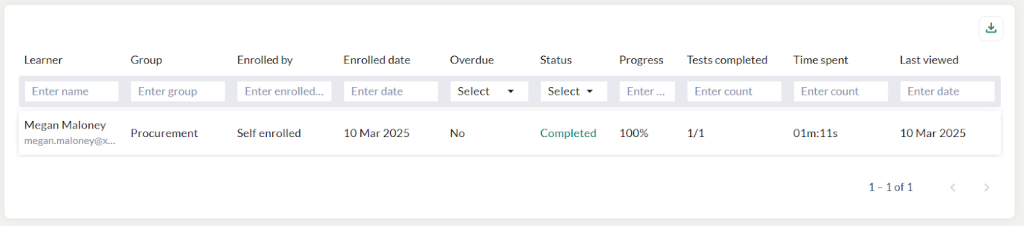
- You can view the learner name, group, overdue, status, progress percentage, and last accessed date.
- The total time spent by the learner will be displayed.
- Click the Download icon to export the course enrollment summary report in CSV format.
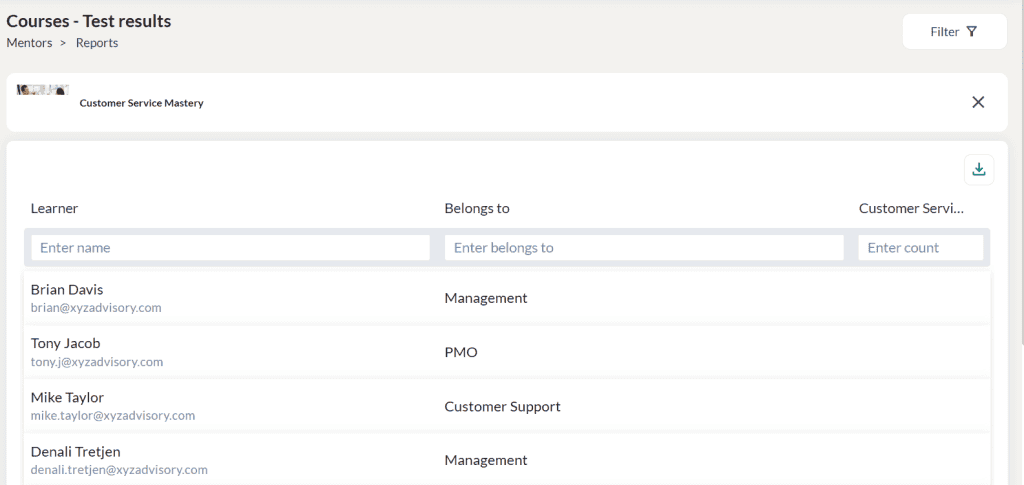
Leaner’s Test results for a self-paced course
The Mentors can click on the Test Results menu to view the test result of all the learners of the selected self-paced course.
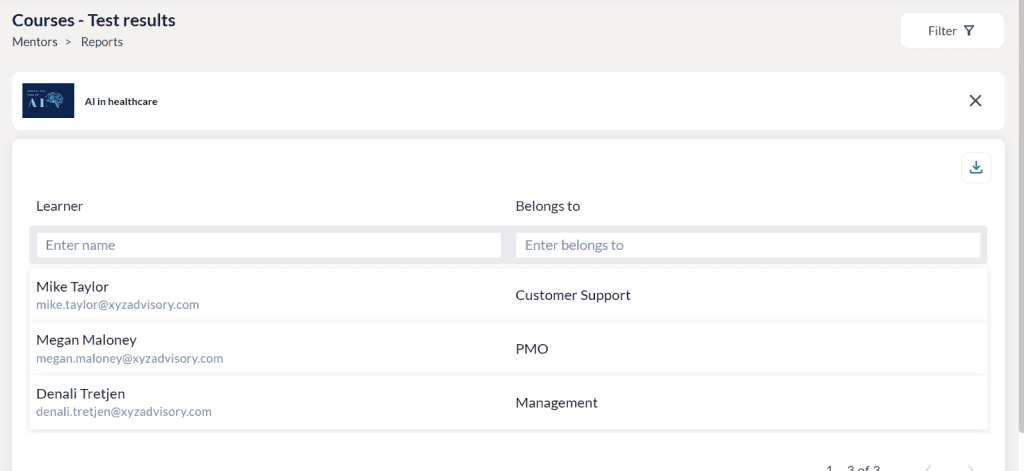
- Select a course for which you want to view the test result of the learners.
- Click the Download icon to export the test result report in CSV format.
Leaner’s pre & post assessment summary of self-paced courses
A pre- and post-assessment summary helps Admins measure the effectiveness of a course or training program by comparing learners’ knowledge before and after completion. This comparison highlights areas of improvement, identifies remaining knowledge gaps, and provides insights into how well the training objectives were achieved. By tracking progress at both stages, Admins can make data-driven decisions to improve course content, adjust teaching methods, and provide targeted support where needed.
The Mentors can click on the Pre & post assessment summary report to view the summary of the pre and post assessment of the tests conducted for the learners in the selected self-paced course.
Note: This report can be generated only if the pre assessment and post assessment tests are added to the selfpaced courses.

- Select a course for which you want to view the pre and post assessment report of the learners.
- At a glance section displays the total learners attended the test and those who completed the assignments.
- This report displays the belongs to department, pre-assessment score, post assessment score and score change.
- Click the Download icon to export the report in CSV format.
Instructor-led Courses
In the Instructor-led Courses menu, the mentors can view 4 reports – the Batch Enrollment summary, report on learner enrollments, test results, attendance summary and pre & post assessment summary for a specific instructor-led course.
Enrollment summary of the instructor-led course batches
The Mentors can view the batchwise enrollment, batch name, respective course name, batch start and end date, batch status, and the count of learner enrollments.
At a glance

- The ‘At a glance’ section displays the total number of enrollments that occurred across the batches during the selected period for the selected course category/levels.
- This section displays the count of learners in the various stages of course completion.
Enrollment breakdown
- This graph displays the count of batchwise enrollment of ILT courses completed, in progress and yet to start status.
- Click on the three dots to download the graph as SVG, PNG or CSV.
Groupwise summary
- This graph displays the groupwise summary of the batchwise enrollment of ILT courses in the selected period/course and category/levels.
- Click on the three dots to download the graph as SVG, PNG or CSV.
Enrollment by batches
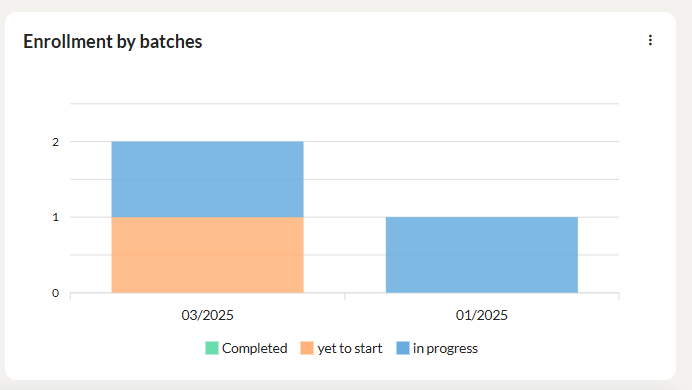
- This graph displays the batchwise enrollment of ILT courses for the months in the selected period and category/levels.
- Click on the three dots to download the graph as SVG, PNG or CSV.

- The Mentors can view the batch name, course name, period of learning, batch status and number of enrollments for each batch.
- Click the Download icon to download the batch enrollment summary report in CSV format.
- You can filter the batch enrollment report using the category, level and period.

- Click on the batch name to display the learners enrolled in the selected batch.
- The total time spent by the learner will be displayed. In the learner report, you can view the enrollment details and their course completion status.
- Click on the Export button to export the report to excel format.
Learner’s enrollment for instructor-led courses
In the Learners report, the Mentors can view the list of learners enrolled in a specific batch created/managed by them, along with their enrollment details and learning progress.
At a glance

- The ‘At a glance’ section displays the total number of enrollments during the selected period and based on the selected filter conditions.
- This section displays the count of learners in the various stages of course completion.
Enrollment breakdown
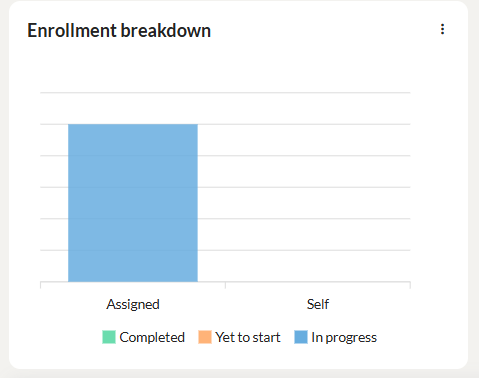
- This graph displays the count of batchwise enrollment of ILT courses completed, in progress and yet to start status.
- Click on the three dots to download the graph as SVG, PNG or CSV.
Groupwise summary
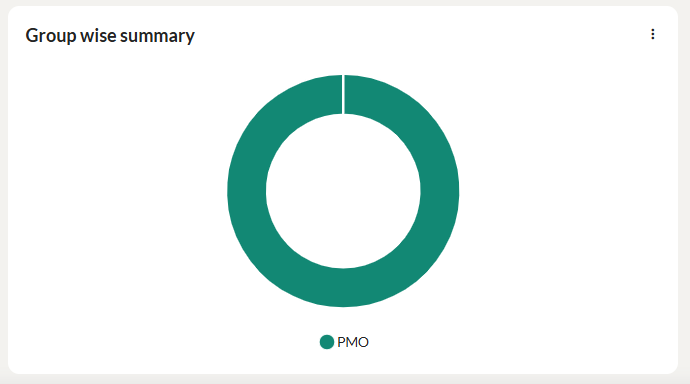
- This graph displays the groupwise summary of the batchwise enrollment of ILT courses in the selected period/course and category/levels.
- Click on the three dots to download the graph as SVG, PNG or CSV.
Enrollment by units
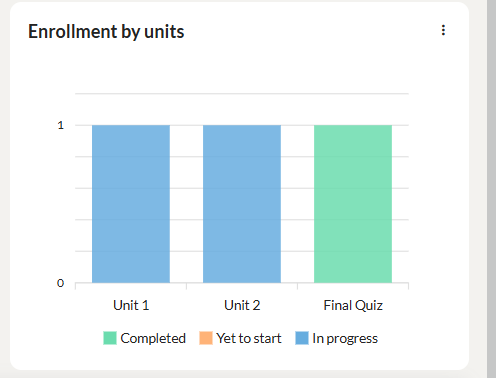
This graph displays the unitwise enrollment of ILT courses for the months in the selected period and category/levels. Click on the three dots to download the graph as SVG, PNG or CSV.
- The Mentors can view the learner’s enrollment details and course status.
- The total time spent by the learner will be displayed.
- Click the Download icon to download the learner enrollment summary report in CSV format.
- You can filter the learner enrollment report using the group, status, learning activity and period.
Learner’s Test results for an instructor-led course
The Mentors can click on the Test Results menu to view the test result of all the learners of the selected instructor-led course.
- Select a course for which you want to view the test result of the learners.
- Click the Download icon to export the test result report in CSV format.
Attendance summary
Mentors can view the attendance details of all sessions in the selected batch.

- Select a batch for which you want to view the learner name, belongs to group and session attended.
- Click on the Export button to export the report to CSV format.
Learner’s pre & post assessment summary of instructor-led courses
A pre- and post-assessment summary helps Admins measure the effectiveness of a course or training program by comparing learners’ knowledge before and after completion. This comparison highlights areas of improvement, identifies remaining knowledge gaps, and provides insights into how well the training objectives were achieved. By tracking progress at both stages, Admins can make data-driven decisions to improve course content, adjust teaching methods, and provide targeted support where needed.
The Mentors can click on the Pre & post assessment summary report to view the summary of the pre and post assessment for the tests conducted for the learners in the selected self-paced course.
Note: This report can be generated only if the pre assessment and post assessment tests are added to the instructor-led courses.

- Select a course for which you want to view the pre and post assessment report of the learners.
- At a glance section displays the total learners attended the test and those who completed the assignments.
- This report displays the belongs to department, pre-assessment score, post assessment score and score change.
- Click the Download icon to export the report in CSV format.
Learning paths
In the Learning paths menu, the mentors can view 2 reports – the Learning Path Enrollment Summary and Learning Paths Learner Enrollments.
Enrollment summary of the learning paths
Click on the Summary menu to view the enrollment summary of the learning paths. You may filter the report based on the category, level for the current month, quarter, year or for a custom date range
At a glance

The ‘At a glance’ section displays the:
- Total number of enrollments among the various learning paths and the count of learners in the various stages of learning path completion.
- The data is displayed based on the selected period in the selected category/levels.
Enrollment breakdown

- This graph displays the count of self enrolled and assigned learning paths in the completed, in progress and yet to start status.
- Click on the three dots to download the graph as SVG, PNG or CSV.
Enrollment status overview

- This graph displays the enrollment status of the learners in percentages for the selected period in the completed, in progress and yet to start status.
- Click on the three dots to download the graph as SVG, PNG or CSV.
Top learning paths

This section displays the top learning paths in which the highest number of completions/enrollments occurred.

- You may view the learning path name, category, count of learners in the various stages of completion and total learners associated with this learning path.
- Click the Download icon to export the learning path enrollment summary report in CSV format.
- Click on the learning path to display its learner enrollment details. Refer for more details.
Viewing learner enrollments for a learning path
Click on the Learners menu to view the enrollment summary of the learning paths. You may filter the report based on the group, status, learning activity, period for the current month, quarter, year or for a custom date range.

- Select a learning path to view its learner enrollments.
At a glance

The ‘At a glance’ section displays the:
- Total number of learning path enrollments and the count of learners in the various stages of course completion.
- The data is displayed based on the selected filters for the selected period.
Enrollment breakdown

- Hover the graph to display the count of self enrolled and assigned learners, in the completed, in progress and yet to start status.
- Click on the three dots to download the graph as SVG, PNG or CSV.
Enrollment status overview

- Hover the graph to display the enrollment status of the learners in percentages for the selected period in the completed, in progress and yet to start status.
- Click on the three dots to download the graph as SVG, PNG or CSV.
Group wise summary

This section displays the top 5 groups in which the maximum number of learning path enrollments occurred.

- You may view the learner name, group to which the learner belongs to, enrolled by user, enrolled date, overdue status, courses completion status, and count of items completed.
- Click the Download icon to export the learning path learner enrollment summary report in CSV format.
Reporting Line
A reporting line, also known as a reporting hierarchy, refers to the organizational structure that outlines the flow of authority, responsibility, and communication within a company. It specifies the direct line of supervision and accountability from one position or individual to another, indicating who reports to whom in a hierarchical manner. It is the people involved in mentoring/guiding the learners. It includes the learner’s mentors, reporting manager, and reporting manager’s reporting manager.
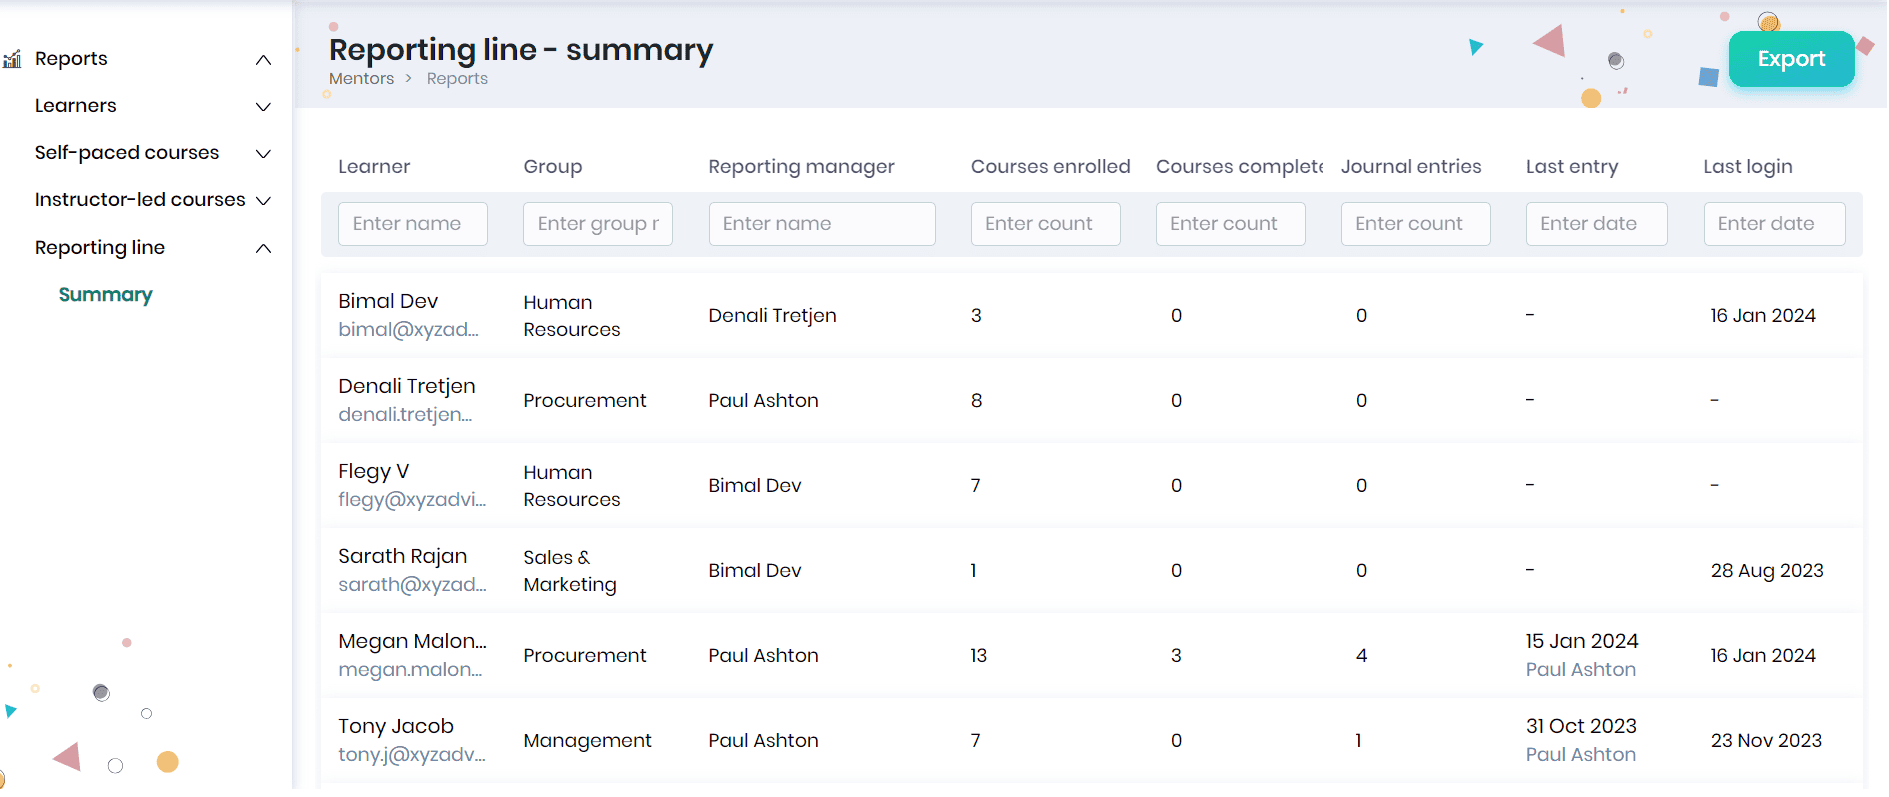
Reporting line summary
Click on the Summary menu to view the summary of the reporting authorities for the learners. The mentors can view the name, organizational group, reporting manager, count of courses enrolled, completed courses and journal entries, last entry date and the last login date of the learner.
You can filter the data by any of the report columns, learner name, group name, reporting manager name, count of enrolled courses, completed courses, journal entries received, date of the last login and date on which they received their last journal entry.
Click the Export button to export the reporting line summary in Excel format.
Leaderboard
In SkillLake, learners earn learning credits by completing self-paced or instructor-led courses, tracked through a ranking system. To make this ranking visible, the Leaderboard has been introduced as an interactive and engaging feature that motivates learners. It allows them to view and compare their ranks within their department and across the organization. Admins can also monitor the rankings of the members they manage.
Viewing Organization leaderboard
Mentors can access the Organizational Leaderboard by navigating to My Team > Reports > Leaderboard > Organization. This report displays the learners managed by the mentor, along with their ranks across the entire organization based on the learning credits they have earned. Mentors can also filter the leaderboard by a specific time period.
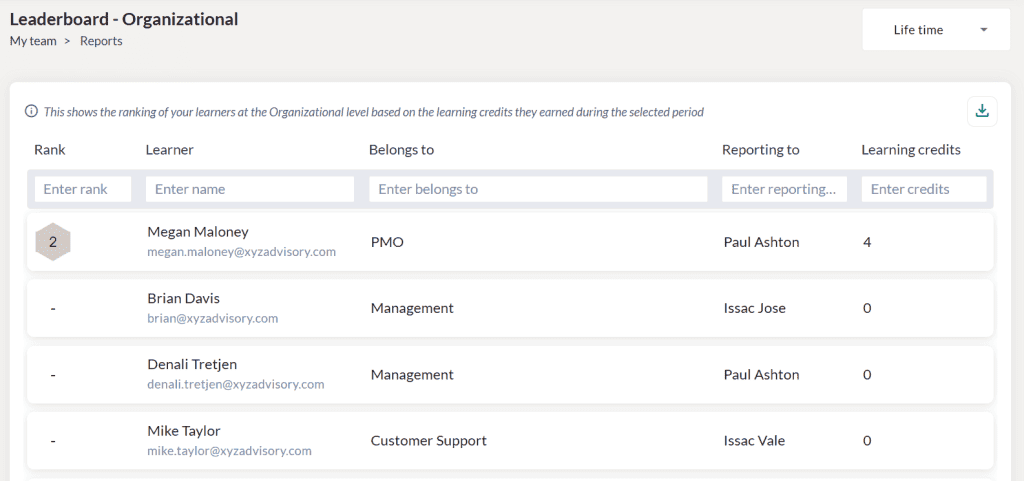
- Assigns a fixed rank to each member based on their credit score in the entire organization.
- If two learners have the same credit score at the organization level, they will share the same rank.
- If the Admin filters a particular department, the leaderboard will show all members from that department, ranked at the organization level based on their credit score.
Viewing Segmented leaderboard
In the Segmented Leaderboard, the Mentors can view the ranking of their learners within their group, based on the learning credits they earned during the chosen time period.
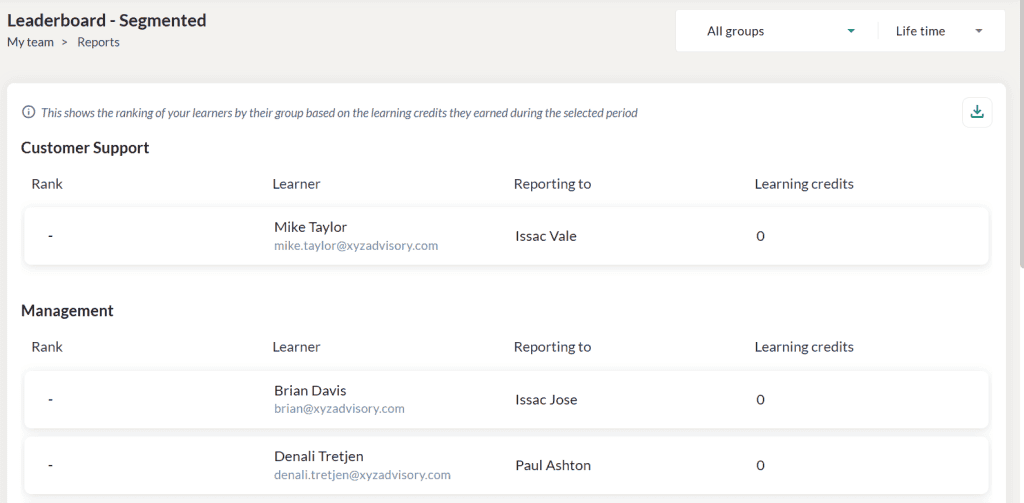
- If the Admin filters the leaderboard by a particular group, the leaderboard will show all learners from that group and its sub groups, ranked based on their credit score.
- The learners having the highest credit score in each department will have Rank 1.
Viewing My learner’s leaderboard
Mentors can view their learners’ ranks based on their learning credits and identify top performers for the selected period.
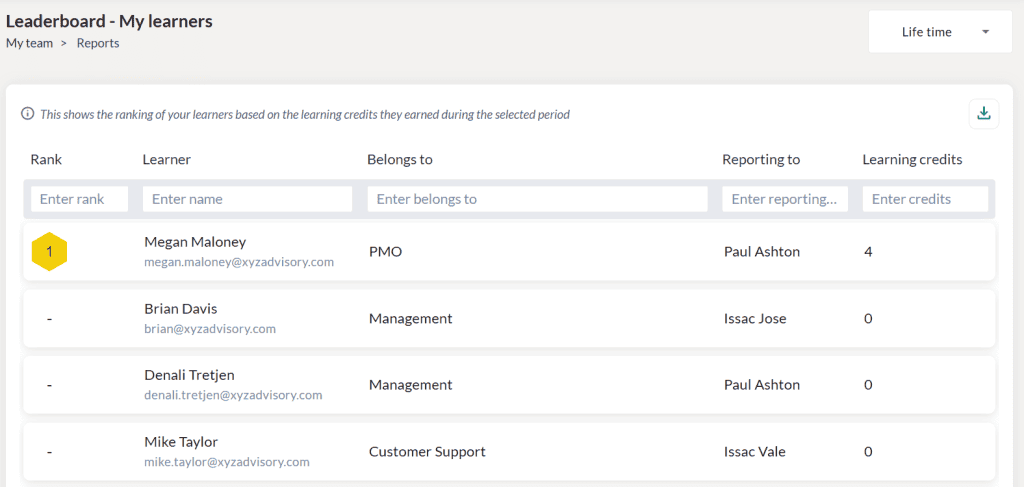
- It will display all members the mentor manages and their rankings.
- If two learners have the same credit score, they will share the same rank.
- If the Admin filters the leaderboard by group, the list will display learners from the group and sub groups and rank them based on their points. The learner with the highest points in this list will be ranked #1, followed by others.