Administrator Reports
- Leaderboard
- Viewing Organizational leaderboard
- Viewing Segmented leaderboard
- Performance review
- Viewing employee wise performance review summary
- Viewing performance review summary
- Viewing learners enrollment summary
- Viewing learners activities
- Viewing learners credits
- View enrollment details
- Viewing enrollment summary of the self-paced courses
- Viewing learner enrollments(detailed)
- Viewing test results
- Viewing feedback summary
- Viewing pre & post assessment summary
- Instructor-led courses
- Course Summary
- Batch Summary
- Learners
- Test results
- Feedback summary
- Attendance summary
- Viewing pre & post assessment summary
- Learning paths
- Summary
- Learners
- Viewing knowledge area summary of the learners
A set of Reports is available to Administrators (users with Administrative privileges) to view the Learning activity and Course enrollment information of the group/sub group to which they belong.
The Reports section is divided in five subsections, namely Leaderboard, Performance Review, Learners, Self-paced Courses, Instructor-led Courses, Learning paths, and Knowledge areas.
Leaderboard
Viewing Organizational leaderboard
The Organization Leaderboard ranks members of the groups an Admin manages based on their overall standing within the organization. Admins can filter the leaderboard based on the organization (if they manage multiple organizations) and period.

- Assigns a fixed rank to each member based on their credit score in the entire organization.
- If two learners have the same credit score at the organization level, they will share the same rank.
- If the Admin filters a particular department, the leaderboard will show all members from that department, ranked at the organization level based on their credit score.
Viewing Segmented leaderboard
In the Segmented Leaderboard, there are two types of reports, Group report and Overall report. The Group Report displays group-wise rankings of the members an Admin manages. For example, if the Admin manages Megan from Products, the report will show Megan’s rank within the Products department.
In the Overall Report, Admin identifies the best performer among all the members they manage. Additionally, Admins can filter the report using the date range orvgroup. If you filter the report using the date range, you may view the member rankings for a specified period. If you filter the report based on the group, you may view the group-wise rankings of the members an admin manages.
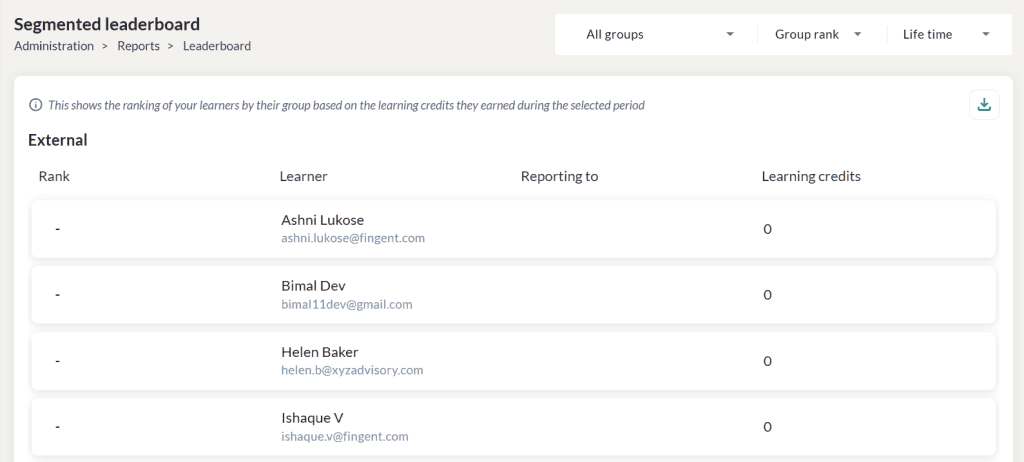
- If the Admin filters the leaderboard by a particular group, the leaderboard will show all learners from that group and its sub groups, ranked based on their credit score. The learners having the highest credit score in each department will have Rank 1. Only 5 members will be displayed per department. Click on the ‘View more’ option to view the remaining learners of a department.
Performance review
In the Performance review section, administrators can view the employee wise performance summary and summary of the performance review of the employees.
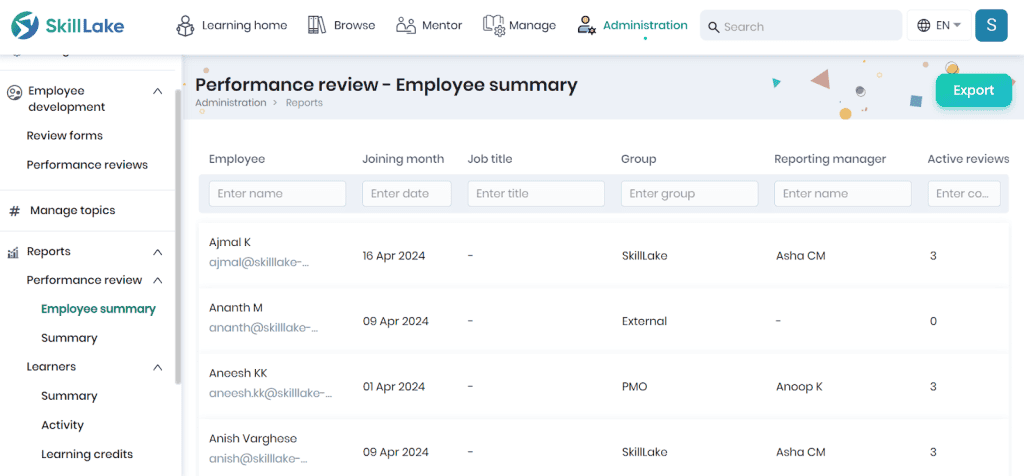
Viewing employee wise performance review summary
- Click on the Employee Summary menu to view the performance review summary of all the employees belonging to the groups/sub groups/learning groups that you are managing.
- The administrators can view the name, joining month, job title, group, reporting manager, and active reviews of the employees.
- You can filter the report using the filters.
- Click on the Export button to export the employees performance review summary report in Excel format.
Viewing performance review summary
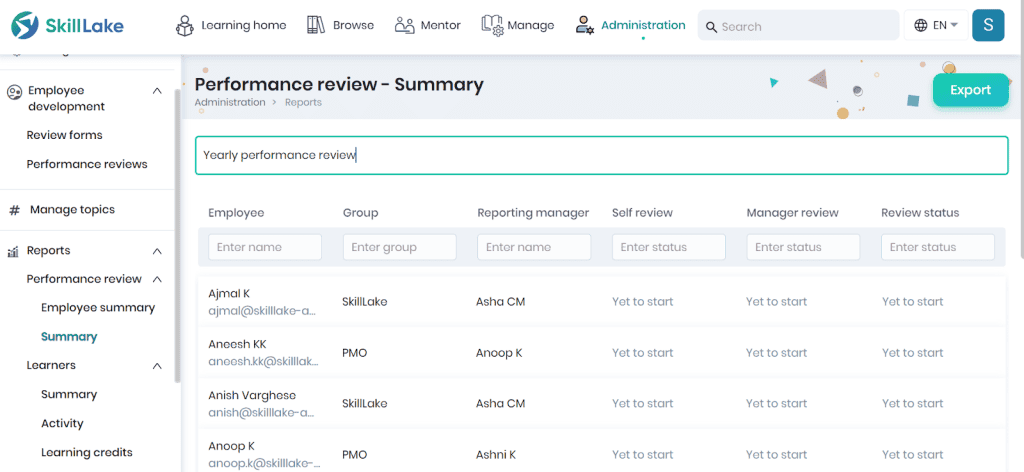
- Select a performance review to view the employees who were included in that review.
- The administrators can view the name of the employee, group to which they belong to, reporting manager, and status of the self review, manager review and review status.
- Click the Export button to export the performance review summary of the employees in Excel format.
Learners
In the Learners section, administrators can view the enrollment summary of the courses (self-paced and instructor-led), the past seven days of activity of the learners of the groups/subgroups they are managing, and the course credits achieved by the learners.
Viewing learners enrollment summary
The Administrators can view the course enrollment breakdown (self-paced and instructor-led) of the learners they manage in the Summary report. You may filter the report based on the group, reporting manager for the current month, quarter, year or for a custom date range.
At a glance

The ‘At a glance’ section displays the:
- Total number of enrollments among the various courses (self paced and instructor-led) and the count of learners in the various stages of course completion.
- Count of feedback received from the learners.
- the data is displayed based on the selected period in the selected category/levels.
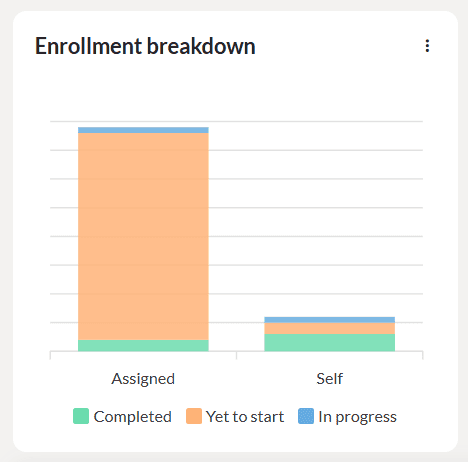
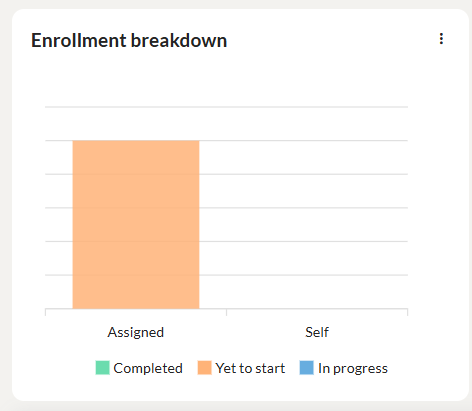
Enrollment breakdown
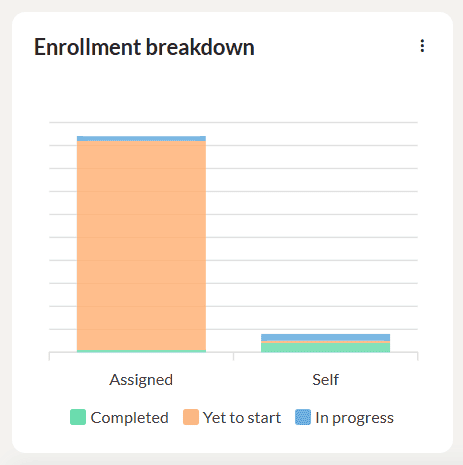
- This graph displays the count of self enrolled and assigned courses(both self-paced and instructor-led) in the completed, in progress and yet to start status.
- Click on the three dots to download the graph as SVG, PNG or CSV.
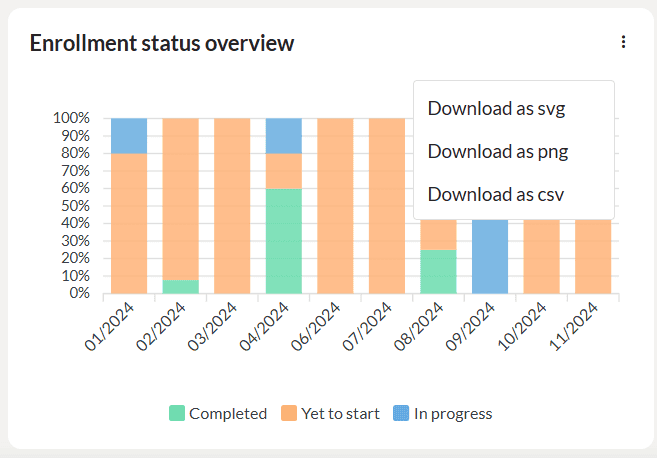
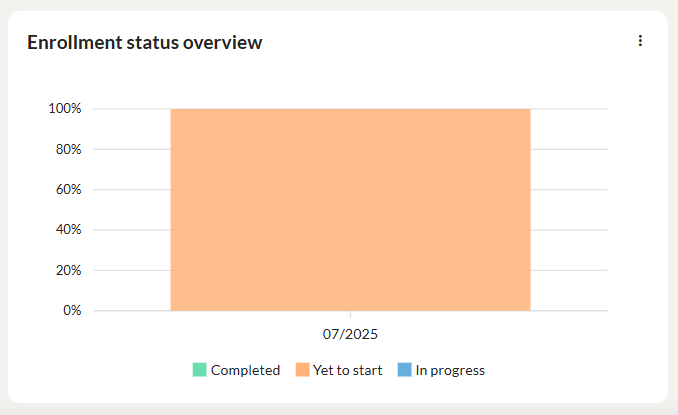
Enrollment status overview
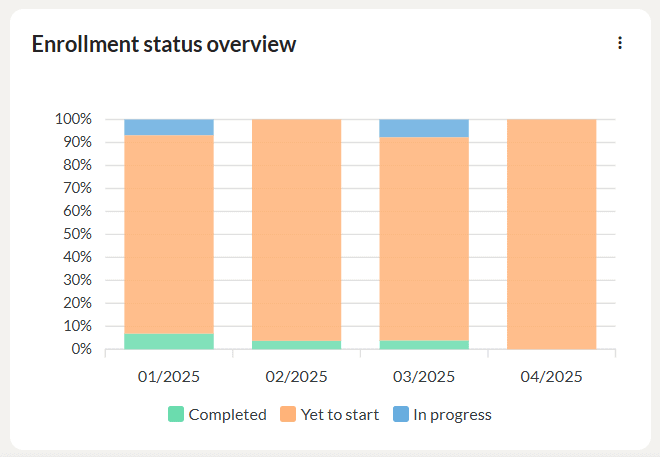
- This graph displays the enrollment status of the learners in percentages for the selected period in the completed, in progress and yet to start status.
- Click on the three dots to download the graph as SVG, PNG or CSV.
Top learners
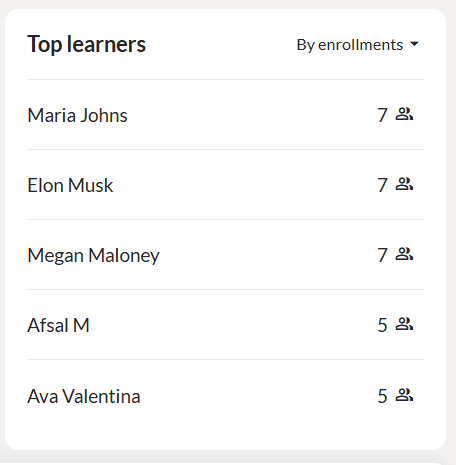
This section displays the top learners in which the highest number of course completions/enrollments occurred.
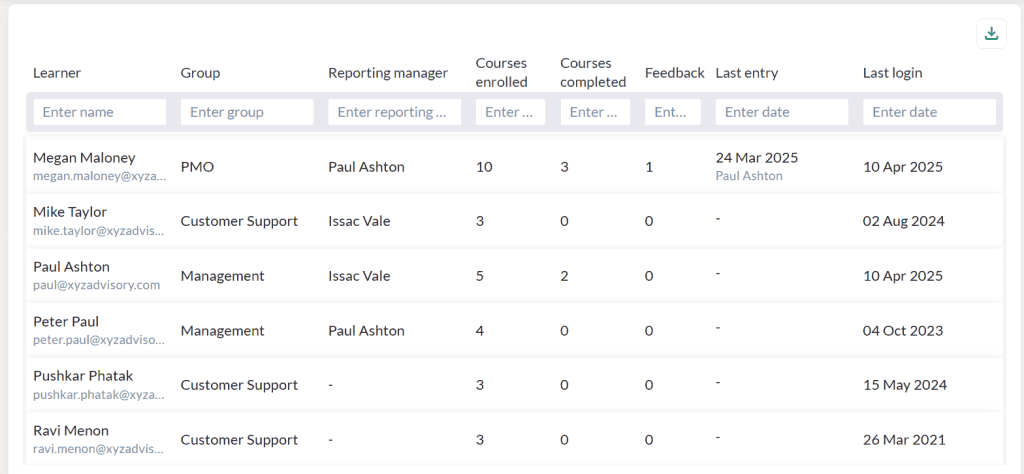
- Administrators can view the learner name, group to which he is part of, reporting manager, count of courses enrolled, completed and feedback received from the learners, learner’s last entry date and previous login date.
- Click the Download icon to export the learner enrollment summary report in CSV format.
Viewing learners activities
The Administrators can view the activities of the learners (of self-paced and instructor-led courses) they manage in the Activity report. You may generate the report based on the selected time period or for a custom date range. You may filter the report based on the learner name, group name, course name, percentage of completion, and learner last accessed date.
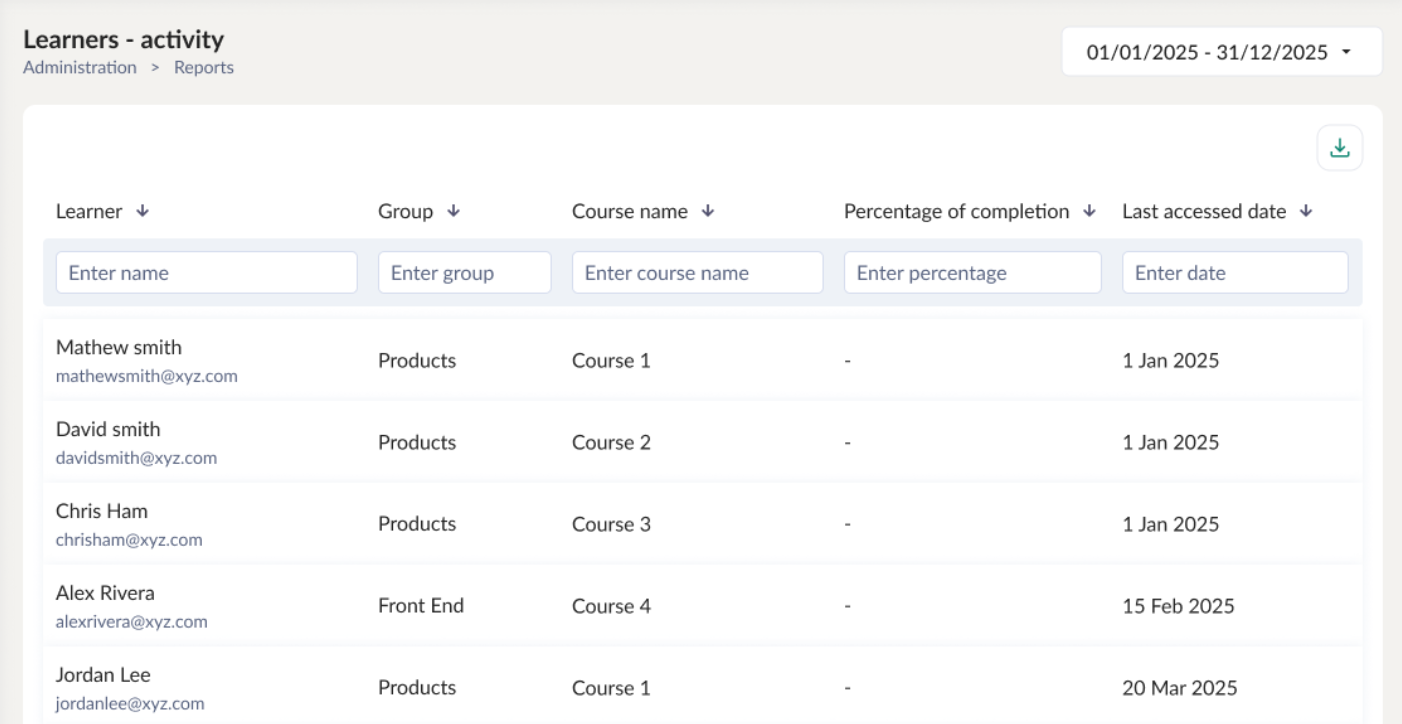
- Click on the Activity menu to track the activity of learners belonging to the groups/sub groups that you are managing.
- The administrators can view the name of the learner, group/sub group to which they belong to, courses in which the learner is enrolled in, percentage of completion, and last access date of the course.
- Click the Export button to export the learner’s past activity in CSV format. You can communicate with your learners using the email ids you get while exporting the report to excel.
Viewing learners credits
The Administrators can view the course credits (from self-paced and instructor-led courses) obtained by the learners they manage in the Learning Credits report. You may filter the report based on the learner, group, course, percentage of completion, and last accessed date.
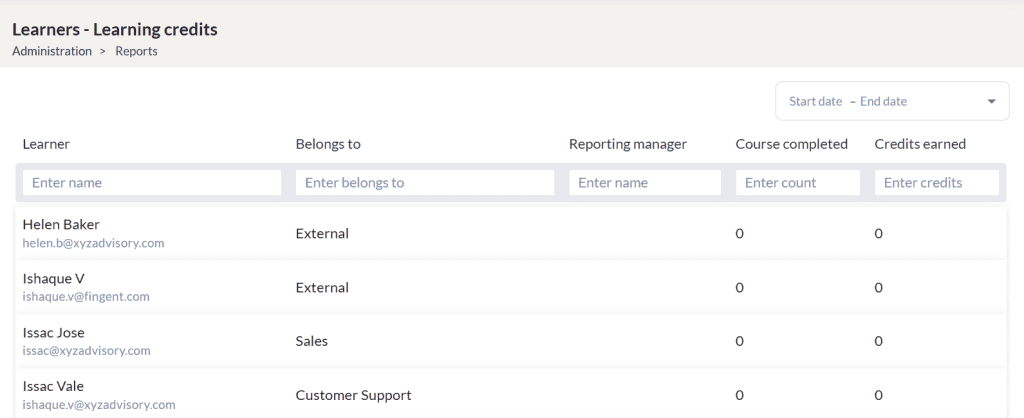
- Click on the Learning credits menu to view the course credits obtained by the learners belonging to the groups/sub groups that you are managing. You may generate the report for the selected period.
- The administrators can view the name of the learner, group/sub group to which they belong to, reporting manager, count of completed courses, and course credits obtained by the learners.
- Click the Export button to export the learner’s course credits in Excel format.
View enrollment details
The Administrators can view the learner enrollments and their status of completion in this report. You may filter the report based on the learner, group, course, self enrolled course count and count of courses in the various stages of completion.
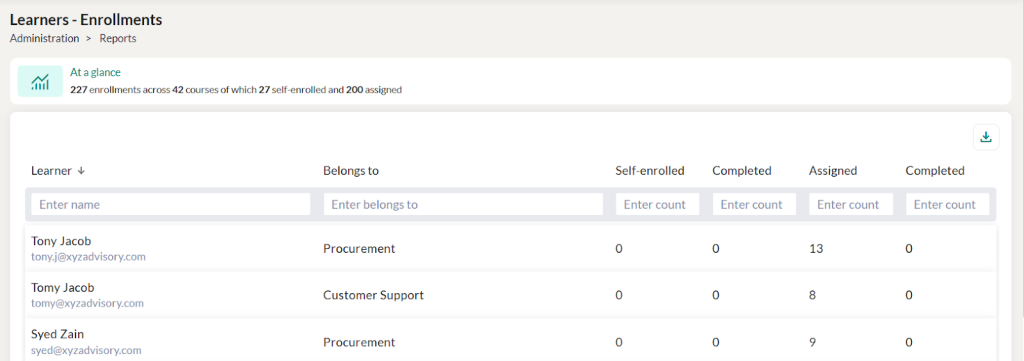
- Click on the Enrollments menu to view the course enrollments of the learners belonging to the groups/sub groups that you are managing.
- The administrators can view the name of the learner, group/sub group to which they belong to, count of self enrolled courses, and count of courses in various stages of course completion.
- Click the Export button to export the learner’s course credits in Excel format.
Self-paced Courses
In the Self-paced Courses report, the Administrators (users with Administrative privileges) can view the enrollment summary, learner enrollments and feedback summary of the self-paced courses available for the groups/sub groups that they are managing.
Viewing enrollment summary of the self-paced courses
The Administrators can view the enrollment summary of the self-paced courses they manage in the Summary report. You may filter the report based on the course category and course level for the current month, quarter, year or for a custom date range.
At a glance

The ‘At a glance’ section displays the:
- Total number of course enrollments among the various courses and the count of learners in the various stages of course completion.
- The data is displayed based on the selected period in the selected category/levels.
Enrollment breakdown
- Hover the graph to display the count of self enrolled and assigned self-paced courses, in the completed, in progress and yet to start status.
- Click on the three dots to download the graph as SVG, PNG or CSV.
Enrollment status overview
- Hover the graph to display the enrollment status of the learners in percentages for the selected period in the completed, in progress and yet to start status.
- Click on the three dots to download the graph as SVG, PNG or CSV.
Top courses

This section displays the top 5 courses in which the maximum number of course completions/enrollments occurred.

- Administrators can view the course name, category, count of learners in the various stages of course completion.
- Click the Download icon to export the learner enrollment summary report in CSV format.
- Click on the course to display the learner enrollment details of that course. Refer for more details.
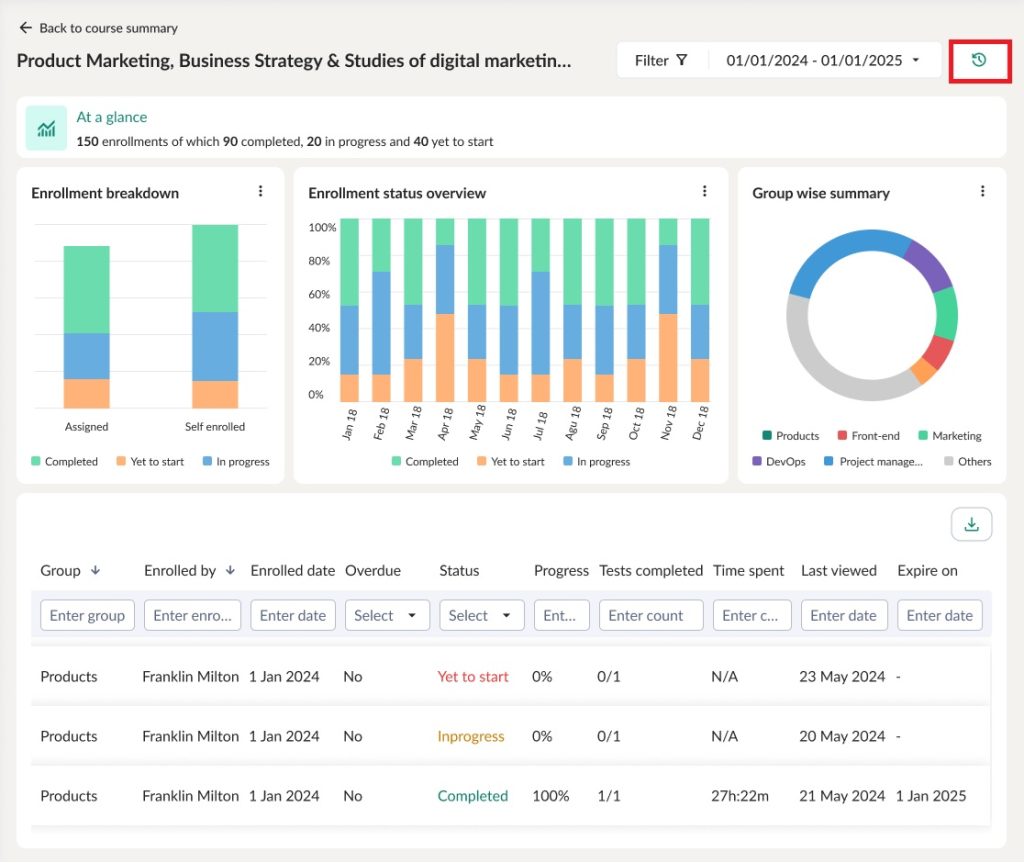
- Click on the required course to view the enrollment breakdown, enrollment status overview, group wise summary and the learner enrollments for that course, which includes the course status, tests completed, last accessed date and expire date.
- The total time spent by the learner will be displayed. You may filter the report based on the filter options.
- Click on the icon to view the historic enrollments of the learner.

Viewing learner enrollments(detailed)
Administrators (users with Administrative privileges) can click on the Learners menu to track the learner’s enrollment for the courses available for the group/sub group they are managing.

- Select a self-paced course to view the learner enrollments of that course.
At a glance

The ‘At a glance’ section displays the:
- Total number of course enrollments and the count of learners in the various stages of course completion.
- The data is displayed based on the selected period in the selected group/status/learning activities.
Enrollment breakdown

- Hover the graph to display the count of self enrolled and assigned learners, in the completed, in progress and yet to start status.
- Click on the three dots to download the graph as SVG, PNG or CSV.
Enrollment status overview

- Hover the graph to display the enrollment status of the learners in percentages for the selected period in the completed, in progress and yet to start status.
- Click on the three dots to download the graph as SVG, PNG or CSV.
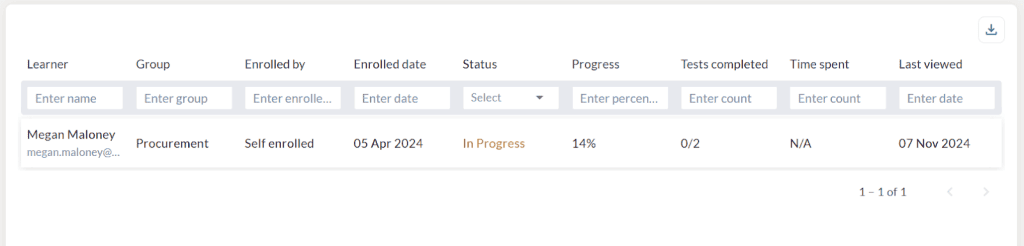
Group wise summary

This section displays the top 5 groups in which the maximum number of course enrollments occurred.

- Administrators can view the learner name, group to which the learner belongs to, enrolled by user, enrolled date, overdue status, courses completion status, progress percentage, count of test completed and course last viewed date.
- Click the Download icon to export the learner enrollment summary report in CSV format.
Viewing test results
The Administrators can view the test results of all the learners of the selected self-paced course.

- Select a course for which you want to view the test result of the learners.
- Click the Download icon to export the test result report in CSV format.
Viewing feedback summary
In this report, the Administrators can view the feedback received from all the learners of the groups/sub groups they are managing for the selected course.

- Select a course for which you want to view the feedback.
- The responses will be displayed based on the type of questions you have answered in the feedback form.
- If you have answered a multiple choice single answer question, then the response will be displayed as a pie-chart.
- If you have answered a rating question, then the response will be displayed as a bar chart.
- If you have answered a free text question, then click on the View icon to view the response.
- Click on the Export button to export the report to CSV format.
Viewing pre & post assessment summary
The Administrators can click on the Pre & post assessment summary menu to view the summary of the pre and post assessment of the tests conducted for the learners in the selected self-paced course.
Note: This report can be generated only if the pre assessment and post assessment tests are added to the selfpaced courses.
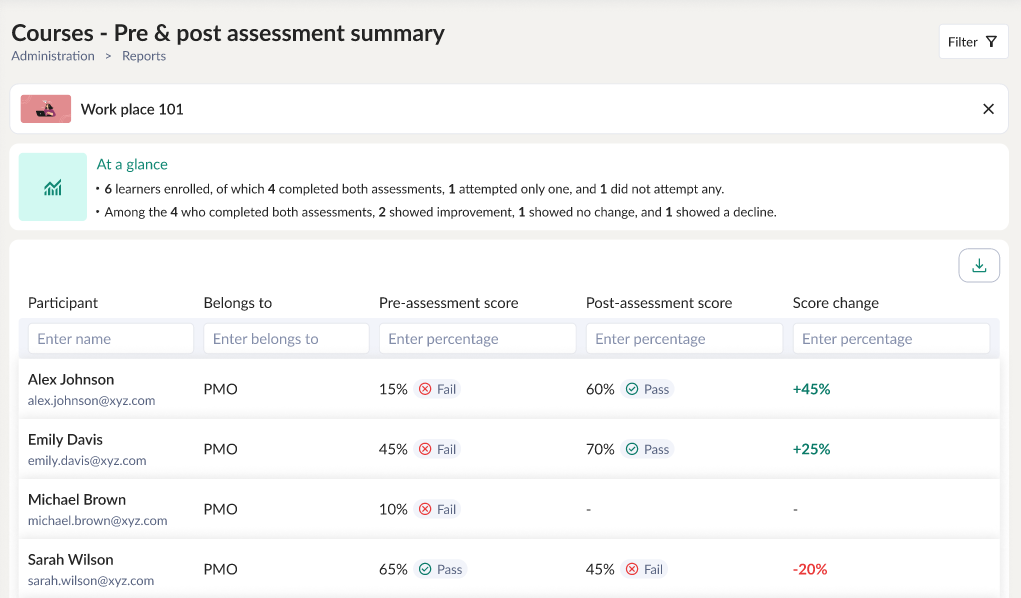
- Select a course for which you want to view the pre and post assessment report of the learners.
- At a glance section displays the total learners attended the test and those who completed the assignments.
- This report displays the belongs to department, pre-assessment score, post assessment score and score change.
- Click the Download icon to export the report in CSV format.
Instructor-led courses
In this section, the Administrators (users with Administrative privileges) can view the summarized report of course enrollment, batch enrollment, learner enrollment and feedback summary of the instructor-led courses of the groups/sub groups that they are managing.
Course Summary
Administrators can view the enrollment summary of the instructor-led courses of the groups/subgroups they manage and the progress of group members against these courses.
At a glance

The ‘At a glance’ section displays the:
- Total number of enrollments for the selected course and the count of learners in the various stages of course completion. The data is displayed based on the selected filters.
Enrollment status overview

- Hover the graph to display the count of self enrolled and assigned instructor-led courses in the completed, in progress and yet to start status.
- Click on the three dots to download the graph as SVG, PNG or CSV.
Group wise summary

- This graph displays the group-wise enrollment summary of the instructor-led course.
- Click on the three dots to download the graph as SVG, PNG or CSV.
Top courses

This section displays the top courses in which the highest number of course /batch enrollments occurred.

- The Administrators can view the course name, count of batches and the count of learners in various stages of course completion.
- Click the Download icon to export the learner enrollment summary report in CSV format.
Batch Summary
The Administrators can view the enrollment summary of the instructor-led courses of the groups/sub groups they are managing.
At a glance

The ‘At a glance’ section displays the:
- Total number of enrollments among the various batches and the count of learners in the various stages of course completion.
- The data is displayed based on the selected period in the selected category/levels.
Enrollment breakdown

- Hover the graph to display the count of self enrolled and assigned instructor-led courses in the completed, in progress and yet to start status.
- Click on the three dots to download the graph as SVG, PNG or CSV.
Group wise summary

- This graph displays the enrollment status of the learners based on the groups/sub groups they belong to.
- Click on the three dots to download the graph as SVG, PNG or CSV.
Enrollment by batches

This section displays the batch-wise enrollment of learners for each month of this year in the various stages of course completion.

- The Administrators can view the batch name, course name, start and end date of course, batch status and count of enrollments.
- The total time spent by the learner will be displayed.
- Click the Download icon to export the batch enrollment summary report in CSV format.
Click on the batch to view the learner enrollments of that batch. Refer for more details.

Learners
The Administrators can view the enrollment summary of the learners of instructor-led courses of the groups/sub groups they are managing. Select the course for which you want to view the enrollment summary.
At a glance

The ‘At a glance’ section displays the:
- Total number of enrollments among the various batches and the count of learners in the various stages of course completion.
- The data is displayed based on the selected period in the selected category/levels.
Enrollment breakdown

- Hover the graph to display the count of self enrolled and assigned learners of the selected instructor-led courses in the completed, in progress and yet to start status.
- Click on the three dots to download the graph as SVG, PNG or CSV.
Group wise summary

- This graph displays the group-wise enrollment status of the learners in the completed, in progress and yet to start status.
- Click on the three dots to download the graph as SVG, PNG or CSV.
Enrollment by units

This section displays the units enrollment of the learners in the various stages of course completion.
- The Administrators can view the learner name, group name, enrolled by, enrolled date, status, progress percentage, count of test completed and last viewed date.
- The total time spent by the learner will be displayed.
- Click the Download icon to export the learner enrollment of the courses in CSV format.
Test results
The Administrators can view the test results of all the learners of the selected instructor-led course.
- Select a course for which you want to view the test result of the learners.
- Click the Download icon to export the test result report in CSV format.
Feedback summary
In this report, the Administrators can view the feedback received from all the learners of the groups/sub groups they are managing for the selected course.
- Select a course for which you want to view the feedback.
- The responses will be displayed based on the type of questions you have answered in the feedback form.
- If you have answered a multiple choice single answer question, then the response will be displayed as a pie-chart.
- If you have answered a rating question, then the response will be displayed as a bar chart.
- If you have answered a free text question, then click on the View icon to view the response.
- Click on the Export button to export the report to CSV format.
Attendance summary
In this report, the Administrators can view the attendance details of all sessions in the selected batch.
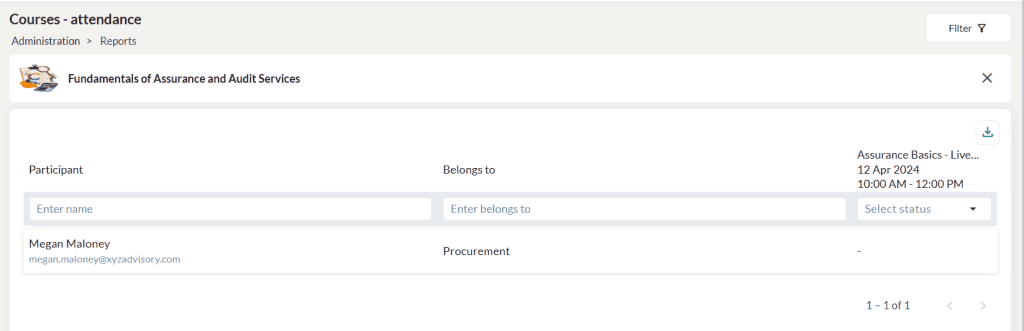
- Select a batch for which you want to view the learner name, belongs to group and session attended. The session status will be displayed as Attended for the attended participants.
- Click on the Export button to export the report to CSV format.
Viewing pre & post assessment summary
The Administrators can click on the Pre & post assessment summary menu to view the summary of the pre and post assessment for the tests conducted for the learners in the selected self-paced course.
Note: This report can be generated only if the pre assessment and post assessment tests are added to the instructor-led courses.

- Select a course for which you want to view the pre and post assessment report of the learners.
- At a glance section displays the total learners attended the test and those who completed the assignments.
- This report displays the belongs to department, pre-assessment score, post assessment score and score change.
- Click the Download icon to export the report in CSV format.
Learning paths
In this section, Administrators (users with administrative privileges) can view a summarized report of learning paths and the learners assigned to each learning path.
Summary
The Summary report provides information about the number of enrollments in each learning path and their current statuses.
At a glance

The ‘At a glance’ section displays the:
- Total number of learning path enrollments and the count of learners at the various stages of course completion.
- The data is displayed based on the selected period and chosen category/levels.
Enrollment breakdown
- Hover the graph to view the count of self enrolled and assigned self-paced courses, in the completed, in progress and yet to start status.
- Click on the three dots to download the graph in SVG, PNG or CSV format.
Enrollment status overview
- Hover the graph to display the enrollment status of the learners in percentages for the selected period in the completed, in progress and yet to start status.
- Click on the three dots to download the graph as SVG, PNG or CSV.
Top learning paths
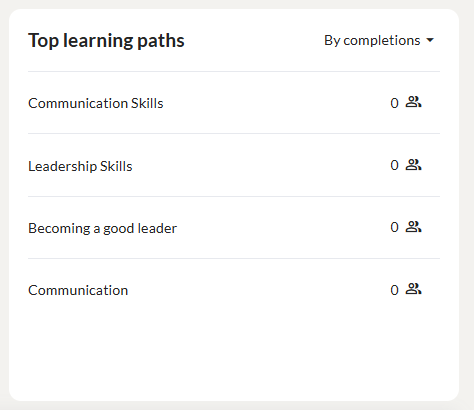
This section displays the top 5 learning paths with the highest number of course completions or enrollments.

- Administrators can view the learning path name, category, count of learners in the various stages of learning path completion.
- Click the Download icon to export the learning path enrollment summary report in CSV format.
- Click on the learning path name to display the learner enrollment details of that learning path. Refer for more details.
Learners
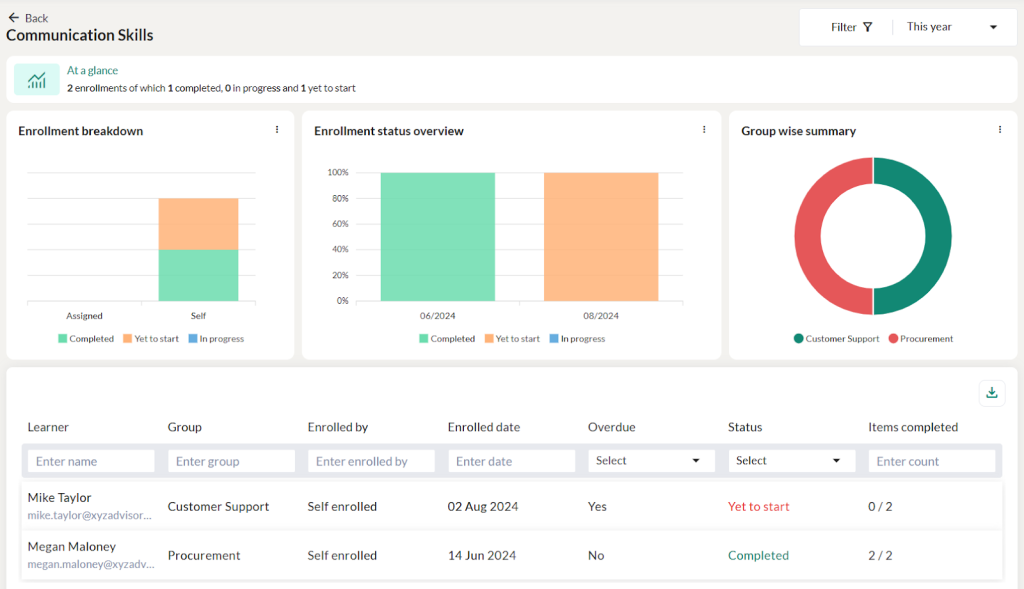
The Administrators can view the enrollment summary of the learners enrolled in the selected learning paths of the groups/sub groups they are managing. Select the learning path for which you want to view the enrollment summary.
At a glance

The ‘At a glance’ section displays the:
- Total number of enrollments of the learning path and the count of learners in the various stages of course completion.
- The data is displayed based on the selected period in the selected category/levels.
Enrollment breakdown
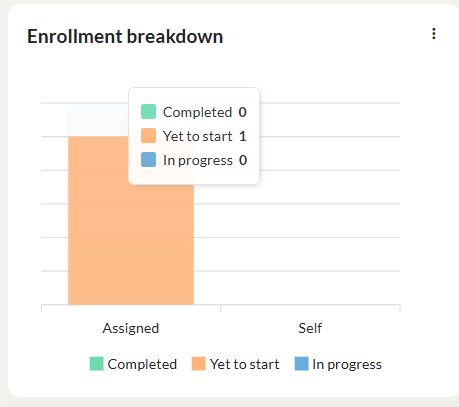
- Hover the graph to view the count of self enrolled and assigned learners of the selected learning path in the completed, in progress and yet to start status.
- Click on the three dots to download the graph in SVG, PNG or CSV format.
Enrollment Status Overview
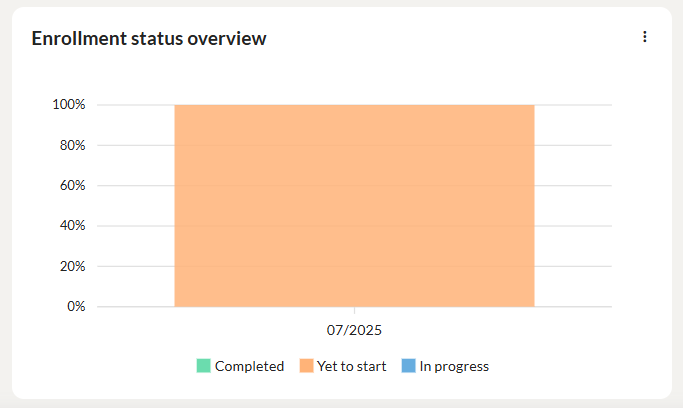
- This graph displays the enrollment status of the learners in the completed, in progress and yet to start status.
- Click on the three dots to download the graph in SVG, PNG or CSV format.
Group-wise summary
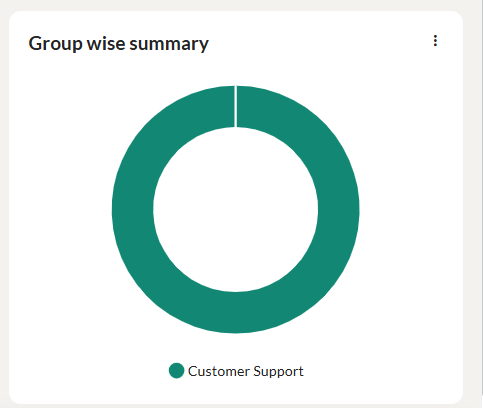
This section displays the group-wise enrollment of learners in the selected learning path.
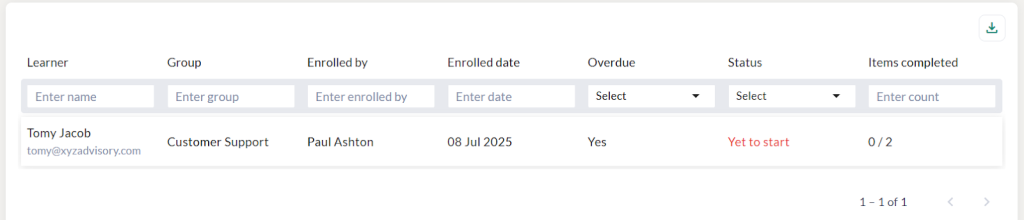
- The Administrators can view the learner name, group name, enrolled by, enrolled date, overdue status, completion status, and number of items completed.
- Click the Download icon to export the learner enrollment of the learning path in CSV format.
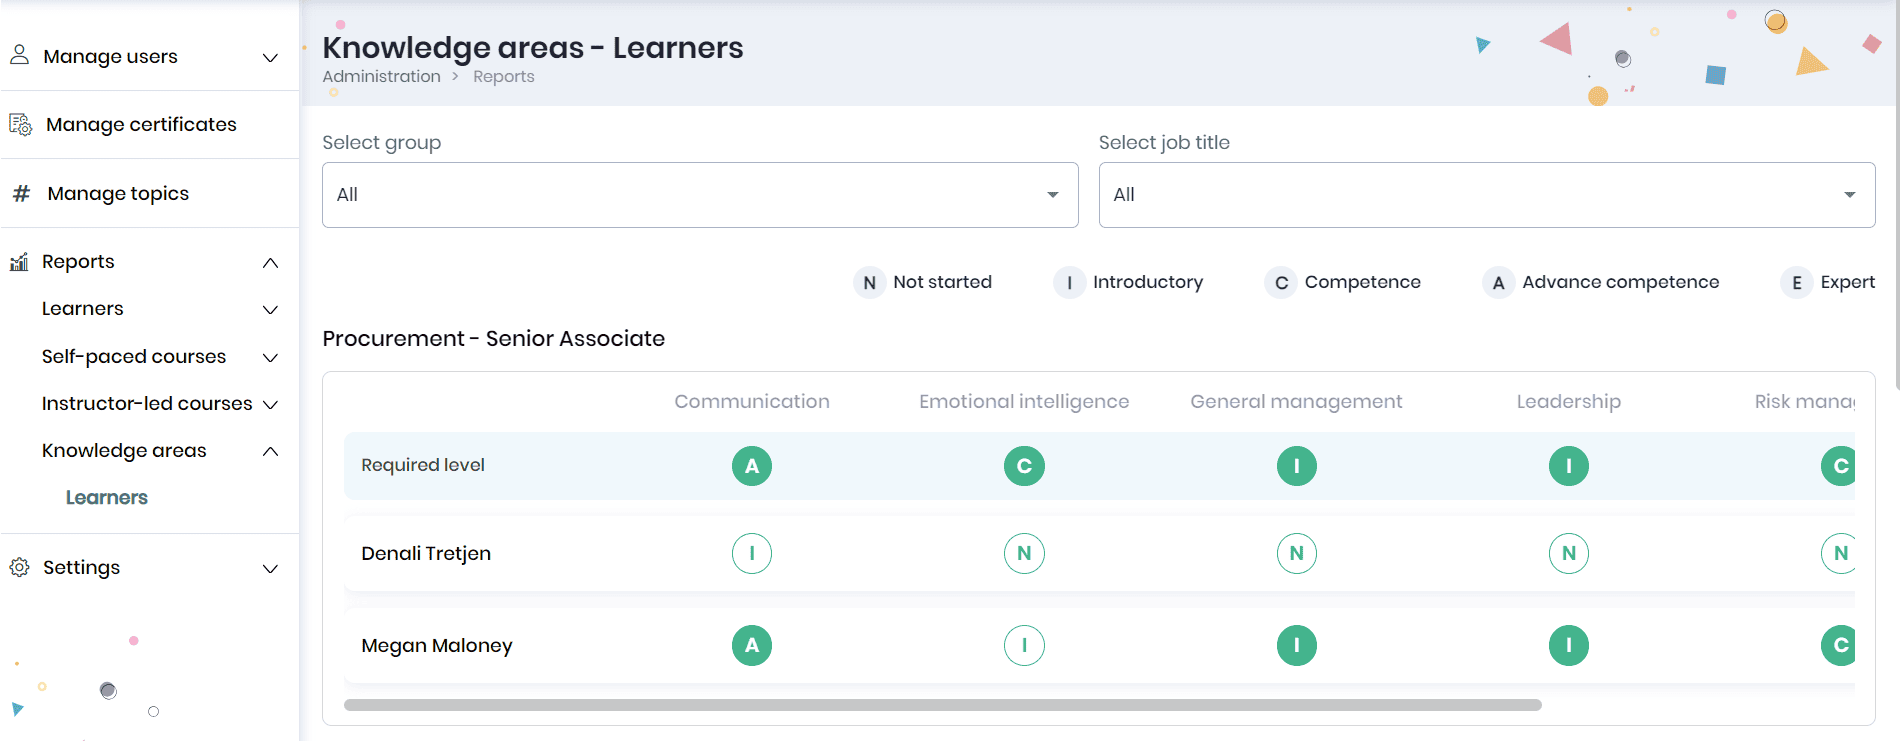
Knowledge areas
In the Knowledge areas report, the administrators can view the knowledge area summary of the learners belonging to the groups/sub groups/learning groups that they are managing.
Viewing knowledge area summary of the learners
Click on the Learners menu to view the current level of the knowledge areas of all the learners. The default view of this report groups the users by the group and job title and provides their current knowledge area levels. The required level is shown at the top of the group for reference. Scroll horizontally to view all the knowledge areas.
You can also filter the report by the group and/or job title to see a filtered list of learners.